Doji Candlesticks
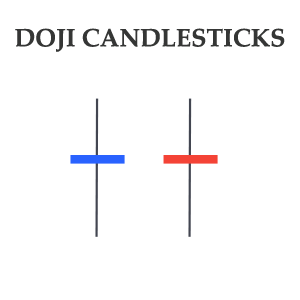
Doji candlesticks frequently appear in the sideways and trending markets. A Doji is neither a continuation nor a reversal candlestick and It just indicates a possible change in the market. A Doji is best known for a period of uncertainty in the market.
To understand more about the Doji candlesticks, let’s assume that on a particular day, the bulls are controlling the market. The price is steadily rising and making higher highs but then a Doji candlestick appears at the top. At this time, the appearance of the Doji candlestick does not necessarily mean that bulls are going to lose control. However, it’s certainly an indication that the bulls are getting exhausted.
A Doji candlestick alone is not considered a strong signal and it usually requires a second confirmation to enter or exit from a trade.
Types of Dojis
There are mainly three types of Dojis which are the Long-Legged Doji, DragonFly Doji, and Gravestone Doji. Despite having different shapes Doji candlesticks indicate a period of uncertainty in the market. The one common thing in these candlesticks is that they all have a small real body.

Dragonfly Doji
A Dragonfly Doji has its real body at the top of the candlestick. In this single candlestick pattern, the long lower wick holds significance which shows that the bears were able to take the price lower but bulls intervened and managed to bring the price back up. However, bulls also failed to take the price higher and ended near the opening price.
If a dragonfly doji appears after a small correction in the uptrend it indicates a possible increase in the buying pressure that may lead to the end of the correction. It’s important to know the dragonfly is not a strong indication and requires a second confirmation.

Gravestone Doji
A gravestone Doji has a long upper wick and a small real body at the bottom of the candlestick. It’s like other Dojis that indicate a possible change in the market and usually require a second confirmation. The long upper shadow shows that the buyers were able to take the price higher. However, the bears managed to bring the price down but failed to take it below the opening price.
A Gravestone Doji that appears after a small correction in the downtrend indicates the selling pressure is once again building up and the downtrend may resume. However, Dragonfly Doji usually also requires another indication to confirm the signal.

Spinning tops
A Spinning Top is almost similar to a Doji candlestick. The only difference is that the real body of the Spinning Top is slightly bigger than Doji candlesticks. These candlesticks usually form long upper and lower wicks. The long wicks are created because of the struggle between the market forces who attempt to take the price in either direction. The real body in the middle once again shows the uncertainty on the future direction of the market.

Marubozu Candlestick
Single candlestick patterns not only indicate market uncertainty but also provide information on the market trend. Marubozu candlesticks are ideal for spotting the trend reversal and continuation. These candlesticks have their opening and closing at their high and low which means they have real bodies but no upper and lower wicks. Unlike Doji, the color of the Marubozu candlesticks holds significance depending on where they appear.
A bullish Marubozu candlestick that appears in the uptrend signals the continuation of the uptrend. Conversely, if a bullish Marubozu candlestick appears in a downtrend it indicates a possible change in the trend. Similarly, if a bearish Marubozu candlestick appears in a downtrend it signals the continuation of the downtrend while if it appears in an uptrend it hints at a possible change in the downtrend.

Single Candlestick Patterns and Multiple Confirmations
Single candlestick patterns are useful as they provide an early indication of a possible change in the market. However, these patterns are not considered very strong and often require a second confirmation from another pattern or a technical indicator.
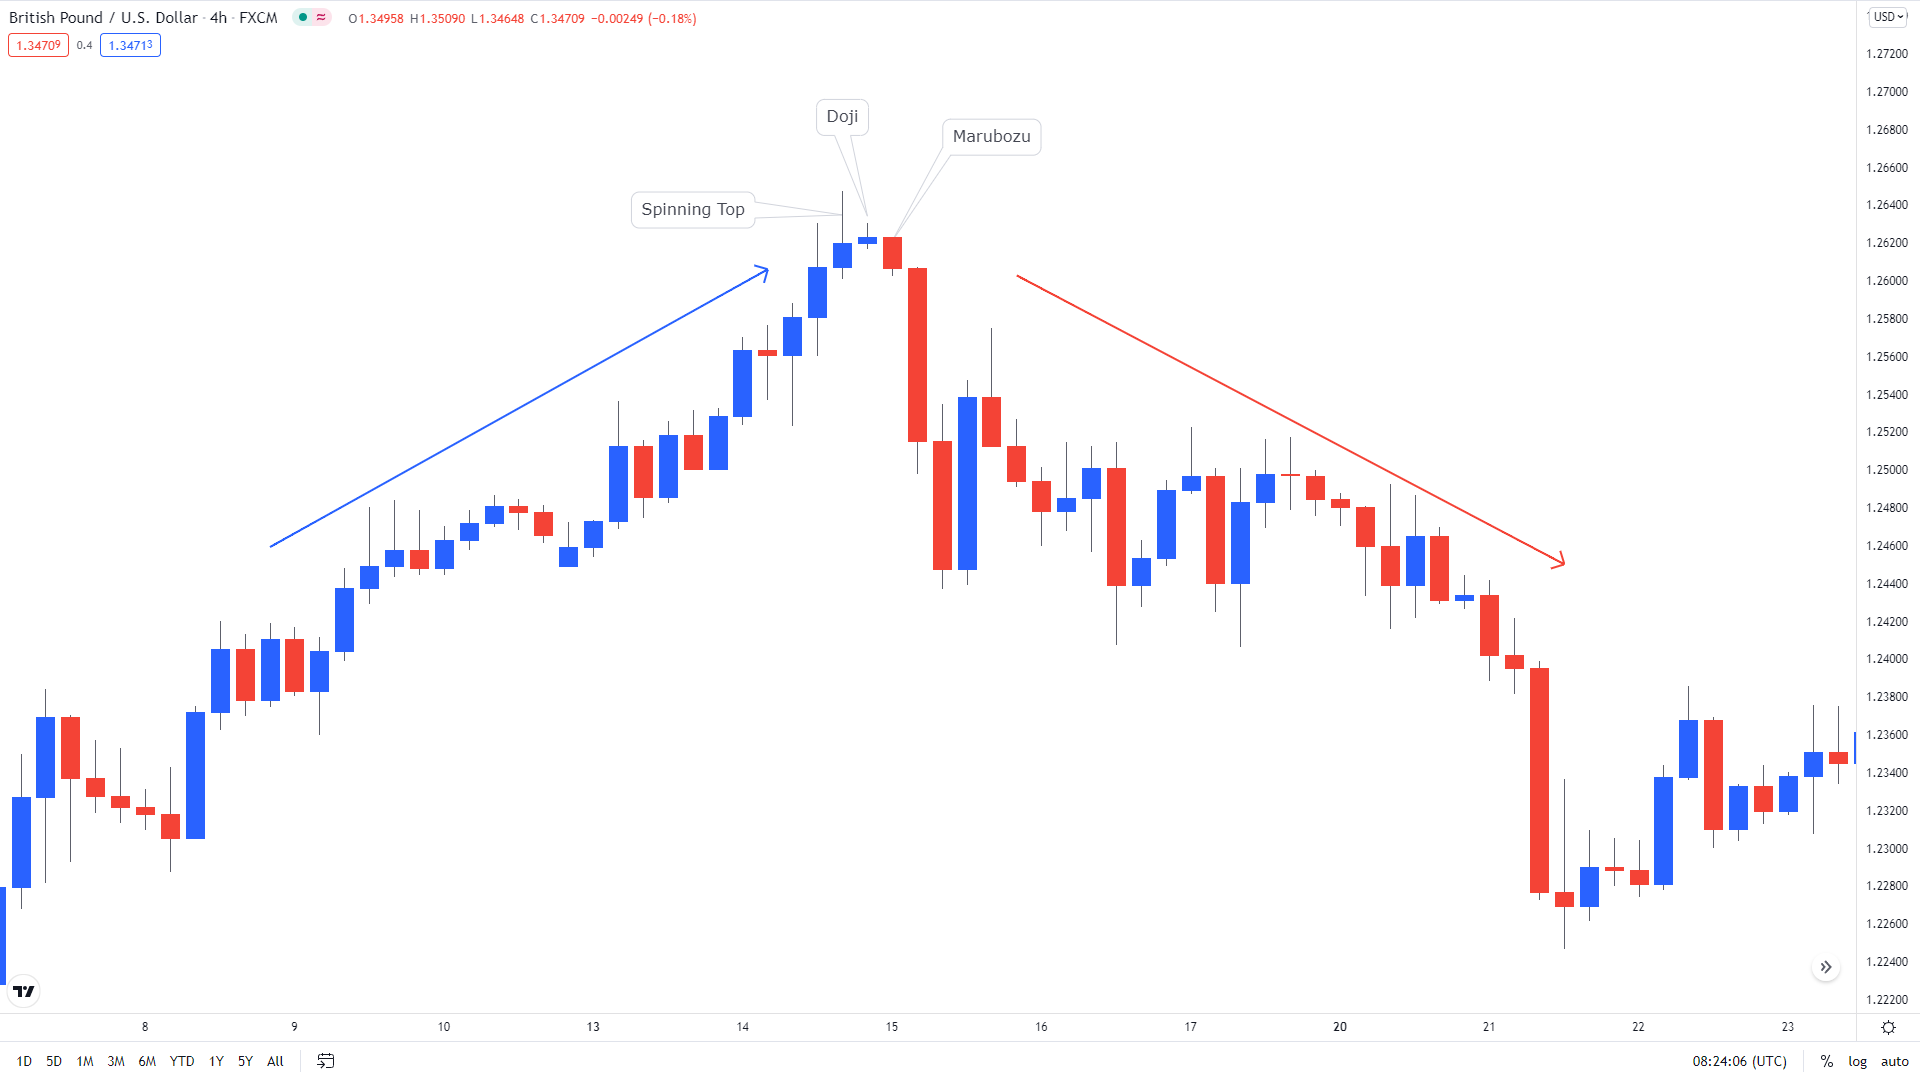
The multiple confirmations add value to the analysis and raise the odds in the favor of a trader. The following example of GBP/USD shows how multiple single candlestick patterns come in handy and help the traders to stay afloat in the market.
You can on the chart, GBP/USD was rising and the bulls appeared in total control until a spinning top indicated some uncertainty at the peak. Soon after the spinning top, the next candle turned out to be a Doji that further confirmed the signal of the spinning top. Finally, in the next session, the third candlestick turned out to be a Marubozu which overwhelmingly confirmed that the uptrend is now going to reverse. Soon after the three confirmations, you can see that the pair started to fall and dropped significantly in the next several sessions.
- Previous Lesson