Engulfing Patterns
An Engulfing Pattern is a reversal pattern that is made up of two candlesticks. The name of the pattern is derived from the size of the second candlestick that completely engulfs the first candlestick. In the engulfing patterns, the sizes of the wicks do not matter and instead, the sizes of the two real bodies are compared. There are two types of Engulfing patterns which are the Bearish and Bullish Engulfing Patterns.
The shape of the pattern reveals that the bears managed to take the market lower but the bulls pushed it back however, they failed to close above the previous closing.
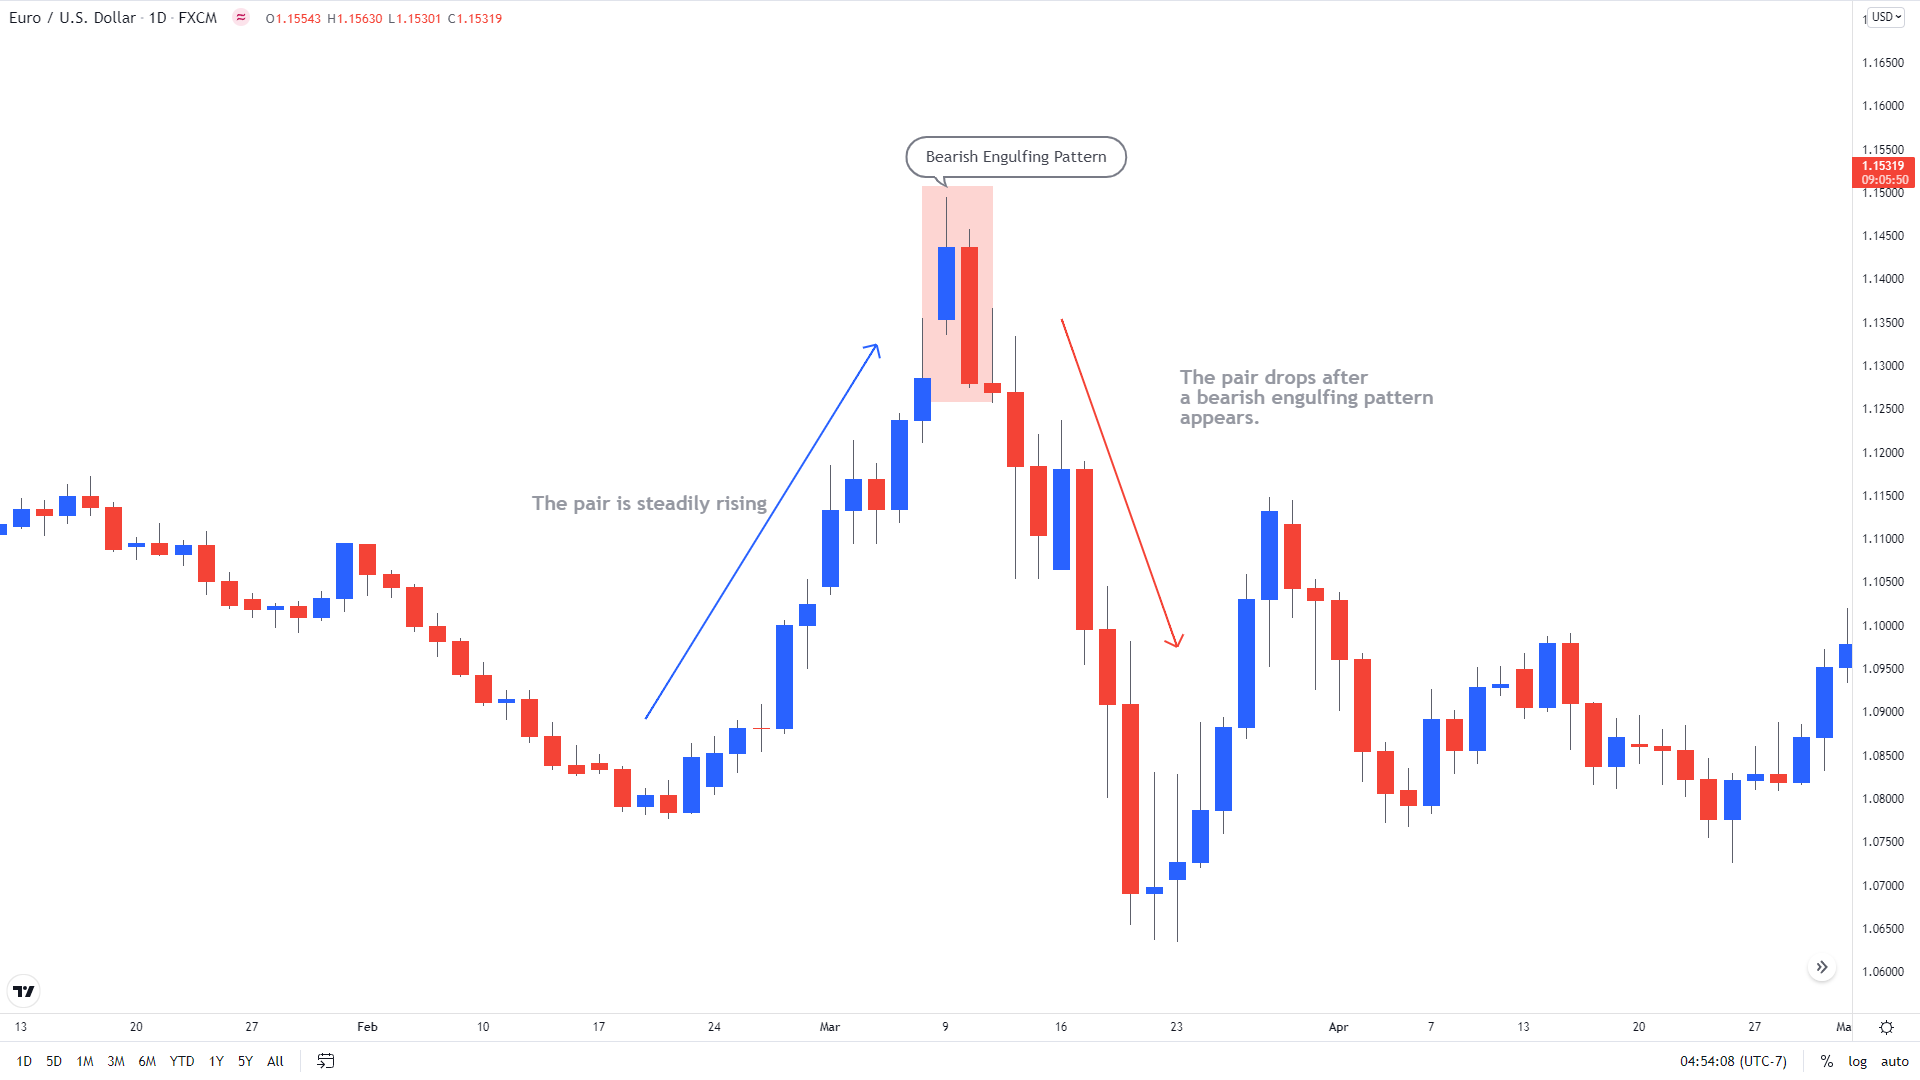
Bearish Engulfing Patterns
As the name says the Bearish Engulfing Pattern indicates a bearish reversal meaning the rising prices may pause and change the direction. The pattern consists of two candlesticks. The first candlestick in the pattern is bullish while the second candlestick is bearish. The size of the second bearish candlestick holds real significance and it needs to be big enough to completely engulf the first bullish candlestick.
When a Bearish Engulfing Pattern is formed the idea is to exit from the long positions that you may be holding and prepare to take the new short entries.

Let’s understand the effectiveness of a bearish engulfing pattern with an example of the EUR/USD chart below. The pair was steadily rising from 1.0800 until a bearish engulfing pattern emerged around 1.1500. The first candlestick in the pattern is bullish while the second candlestick is bearish and it is completely engulfing the first bullish candlestick. The pattern indicated a reversal and soon after the indication, the pair dropped towards 1.0600.
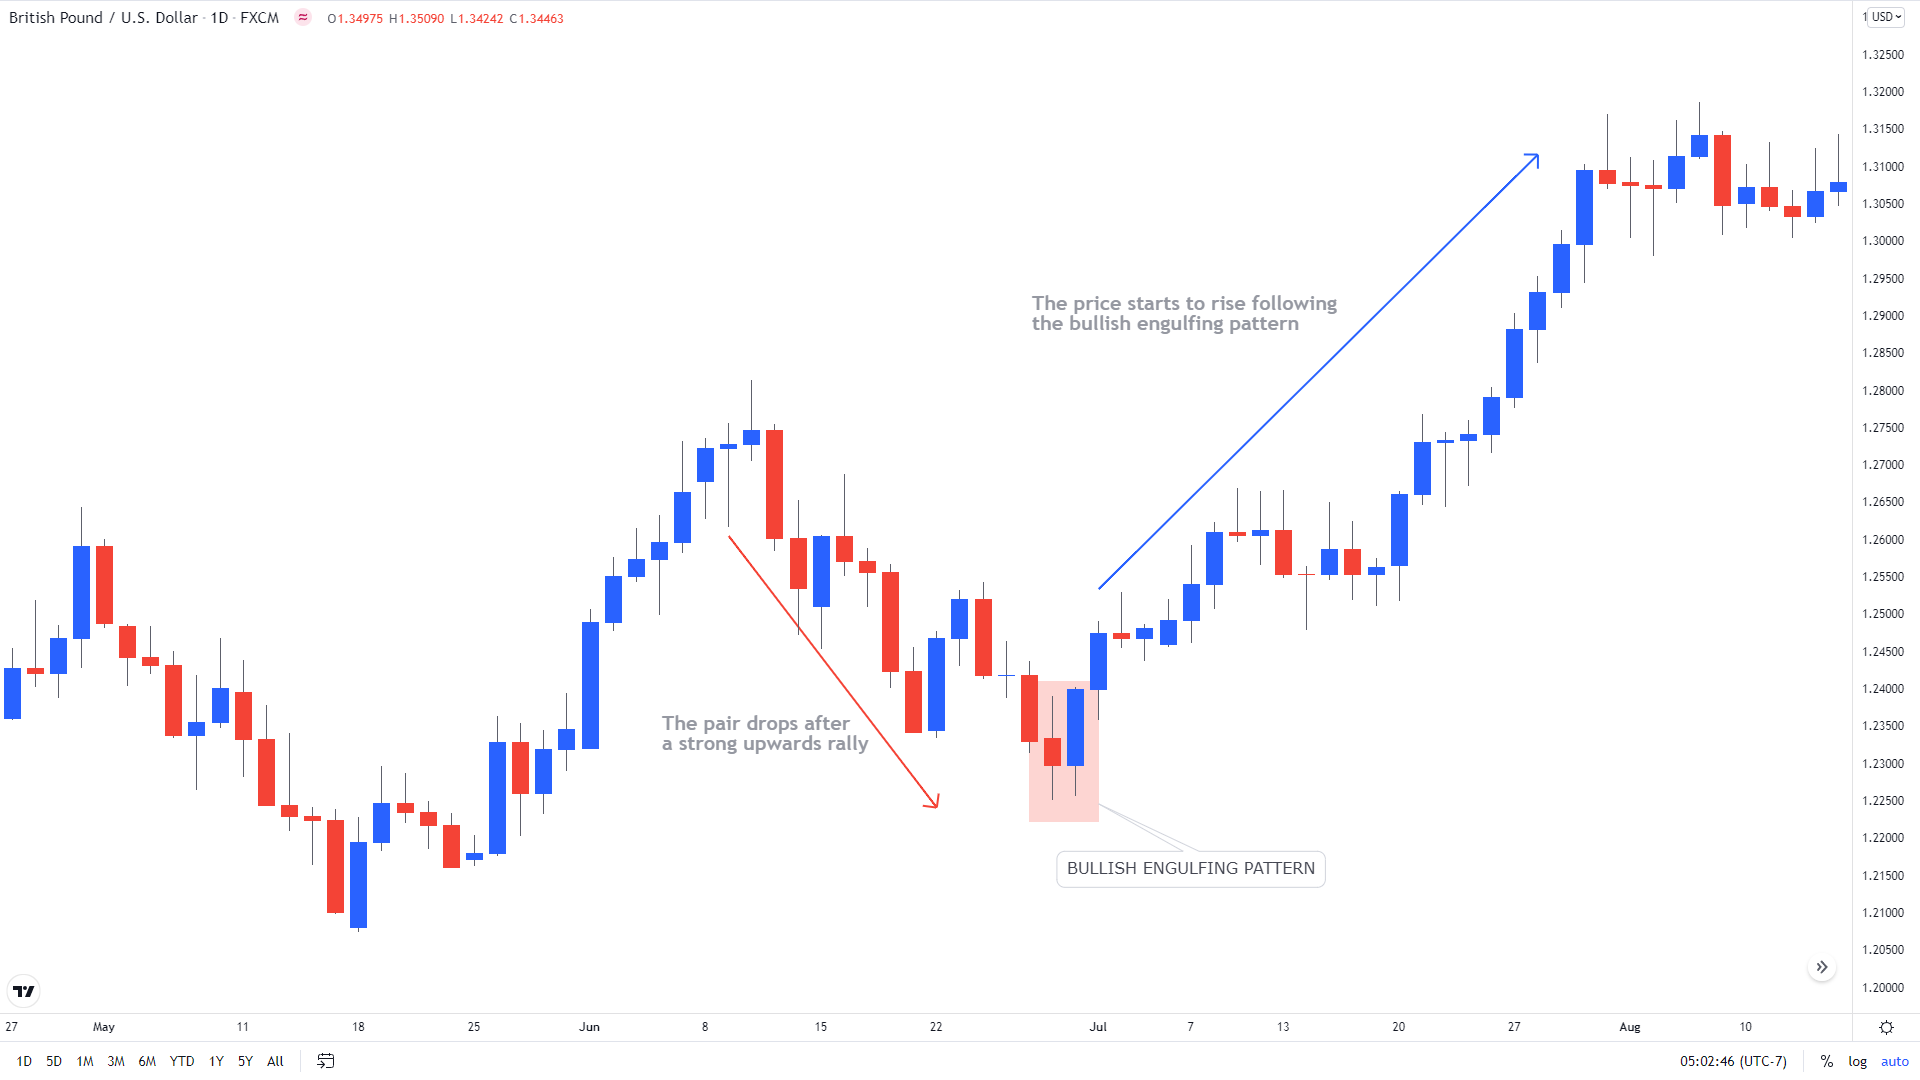
Bullish Engulfing Patterns
A Bullish Engulfing Pattern indicates a bullish reversal meaning that the falling price of an instrument may stop and start to recover. The pattern also consists of two candlesticks, but unlike the Bearish Engulfing Pattern, the first candlestick in this pattern is bearish while the second candlestick is bullish. As a general rule of thumb, the second bullish candlestick should completely wrap the first bearish candlestick.
The pattern indicates bullish momentum and when this pattern emerges traders usually close their sell position and start planning to take new long positions.

The following chart of the GBP/USD is a classic example of a Bullish Engulfing Pattern. You can see on the chart the pair started to drop following a brief rally towards 1.2800. After dropping nearly 200 pips a Bullish Engulfing Pattern was formed at the bottom. In the pattern, the second bullish candlestick is completely engulfing the first bearish candlestick. The pattern indicated a bullish reversal and soon after the indication, the pair start to move higher towards 1.3100.