Hammer Candlestick
Hammer is one of the widely recognized single candlestick patterns that indicates a possible bullish reversal. The shape of the hammer candlestick consists of a long lower wick and a small real body at the top. The upper wick is either very small or does not exist at all. In a hammer pattern, the color is not important but the real body and lower wick are important. For a hammer candlestick to be valid, the size of the lower wick needs to be double the size of the real body.
In theory, the hammer shape signifies that the bears may lose control because the bulls were able to bring the price back up and managed to close near or above the opening price. The hammer pattern is considered a strong reversal pattern. Its signal is considered even stronger if the next candlestick opens above the closing of the hammer. However, a higher opening in Forex trading is a rare case.

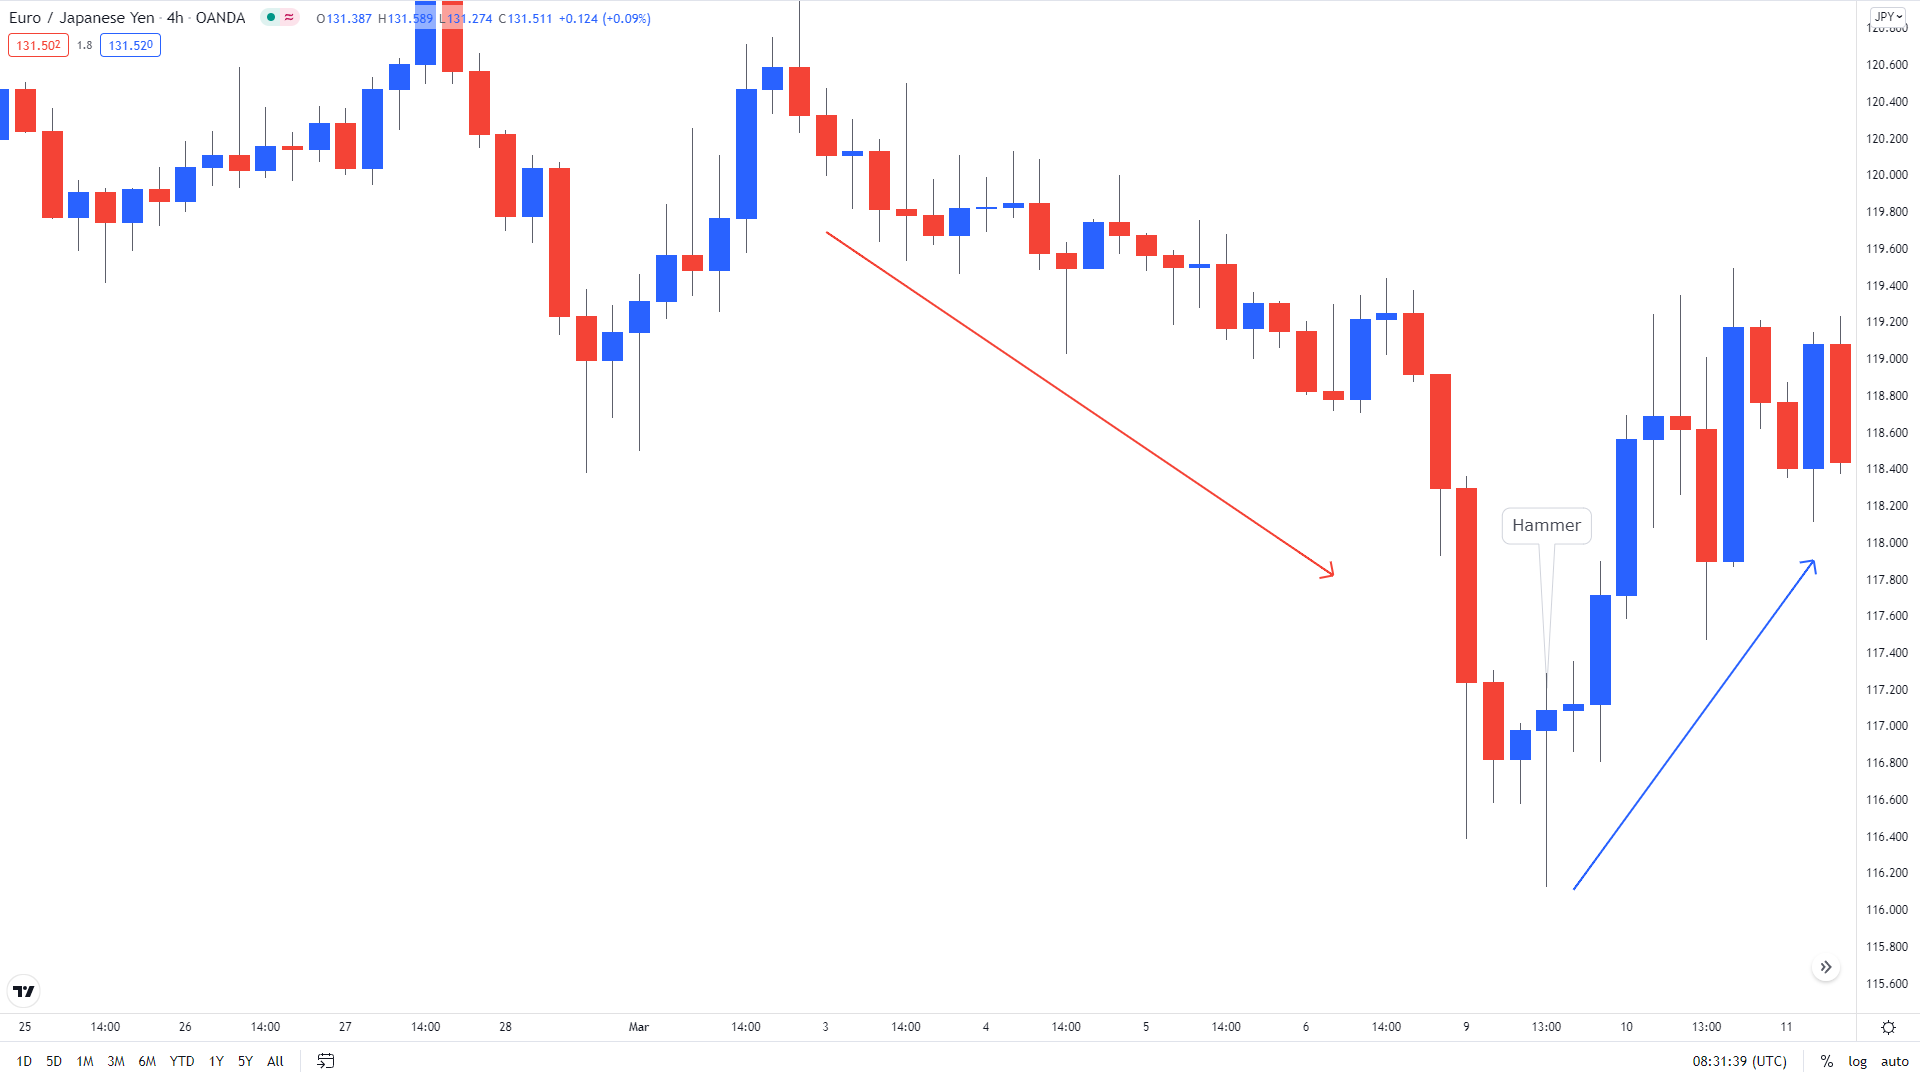
The following chart of EUR/JPY is an ideal example of a Hammer pattern. EUR/JPY was dropping from 121.00 until a small Doji indicated uncertainty among the sellers near 116.40. Following the Doji, a Hammer candlestick appeared in the next session confirming the bullish reversal. Soon after the Hammer indication the pair started to rise and made a decent rally towards 119.00