Tweezer Tops and Bottoms
Tweezer Tops and Bottoms are reversal patterns. The patterns are easy to spot and provide valuable information on the ongoing trend. The patterns consist of two candles that have either matching lows or matching highs which gives them a tweezer-like shape.
Tweezer Tops
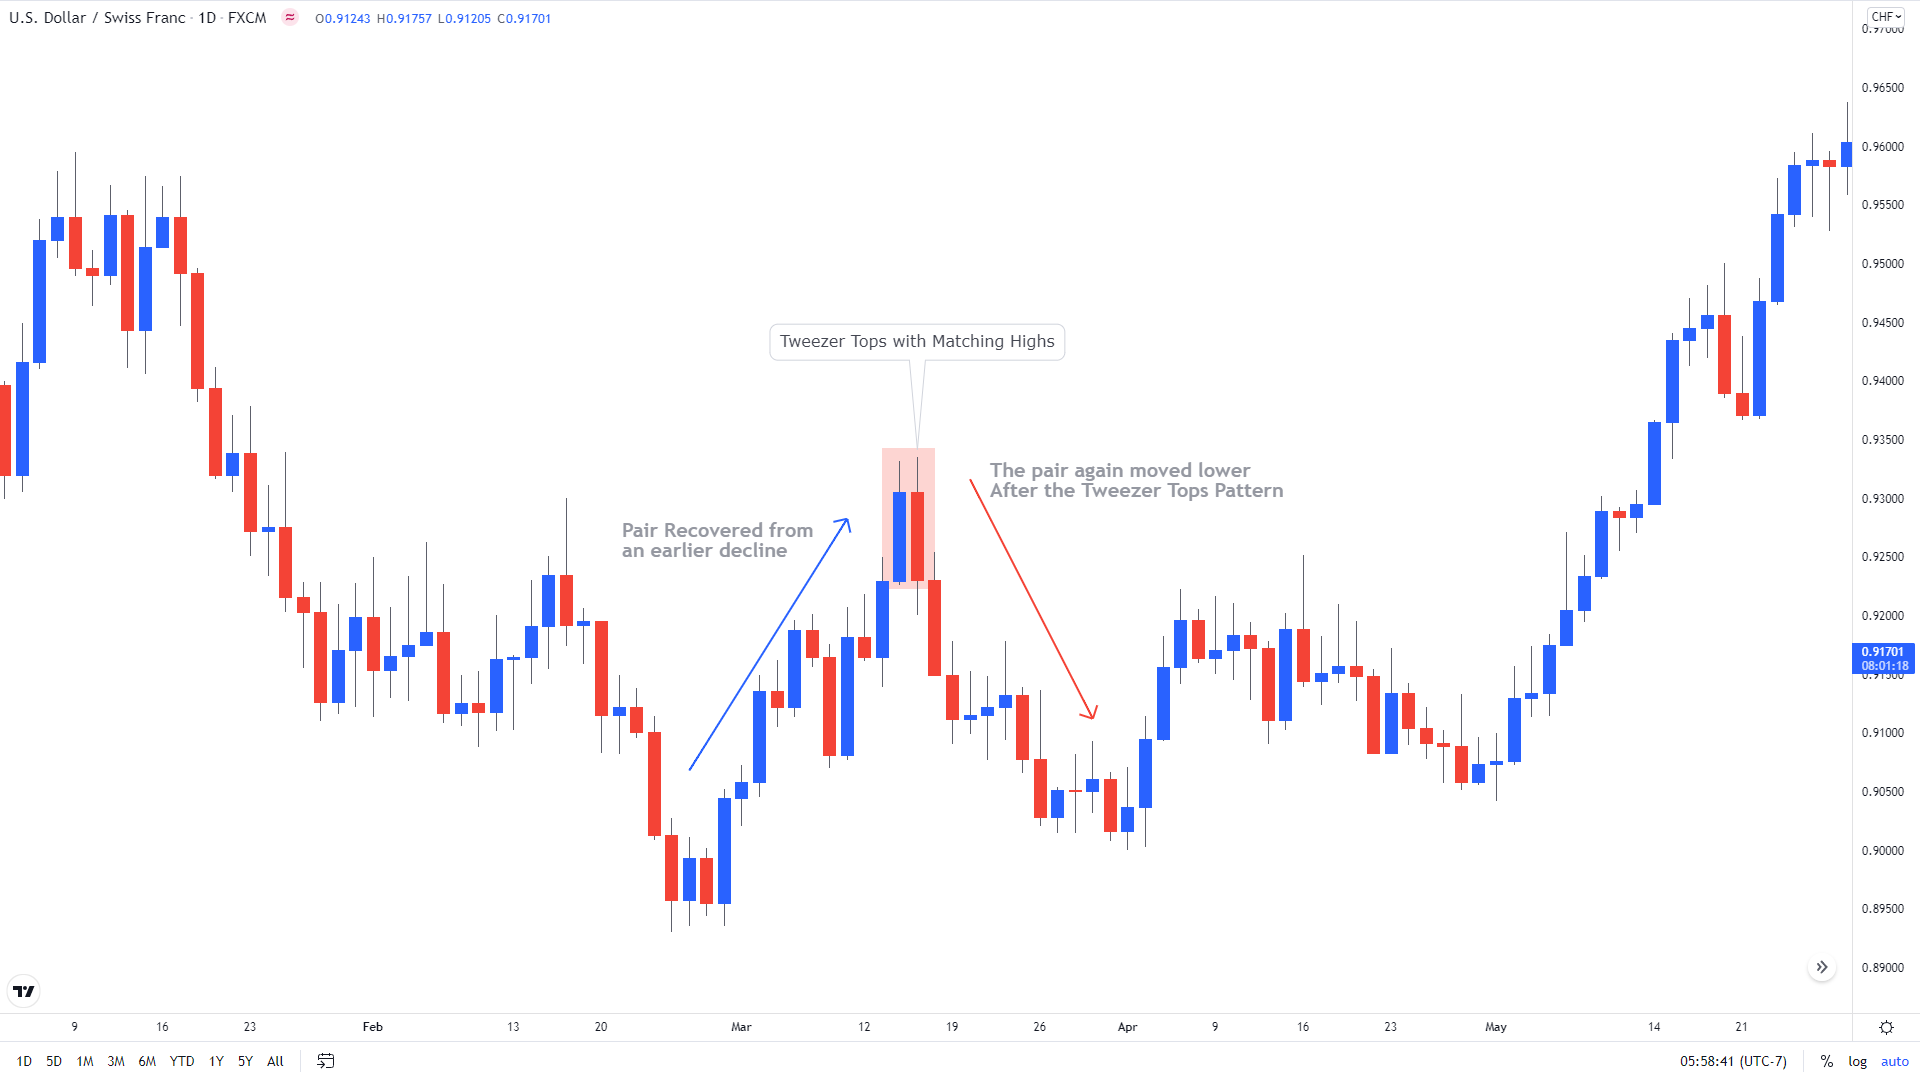
Tweezer tops pattern consists of two candlesticks and indicates a bearish reversal. The first candlestick in the patterns is bullish as it closes in the direction of the ongoing uptrend. The second candlestick in the pattern is bearish and the size of its real body is large enough to match the high of the previous candlestick. The matching highs give the pattern a tweezer-like shape. The pattern is considered further strong if the second candlestick is a Doji or a shooting star.

On the following USD/CHF chart, you can see that the pair was recovering from an earlier decline. However, on its way to recovery, a Tweezer Top pattern emerged near 0.9350. The first candlestick in the pattern is bullish and has a large real body while the second candlestick is bearish and the highs of both candlesticks are matching. The pattern signaled a reversal and the pair once again started to fall.
Tweezer Bottoms
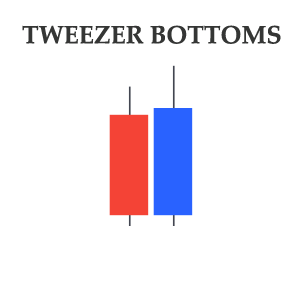
Tweezer Bottoms is the opposite of the Tweezer Tops as it indicates a bullish reversal. The pattern is comprised of two candlesticks in which the first candlestick is bearish and has a large real body. The second candlestick in the pattern can have any color, however, the lows of both the candlesticks should match. The pattern is considered further strong if the second candlestick turns out to be a Doji or a Hammer.
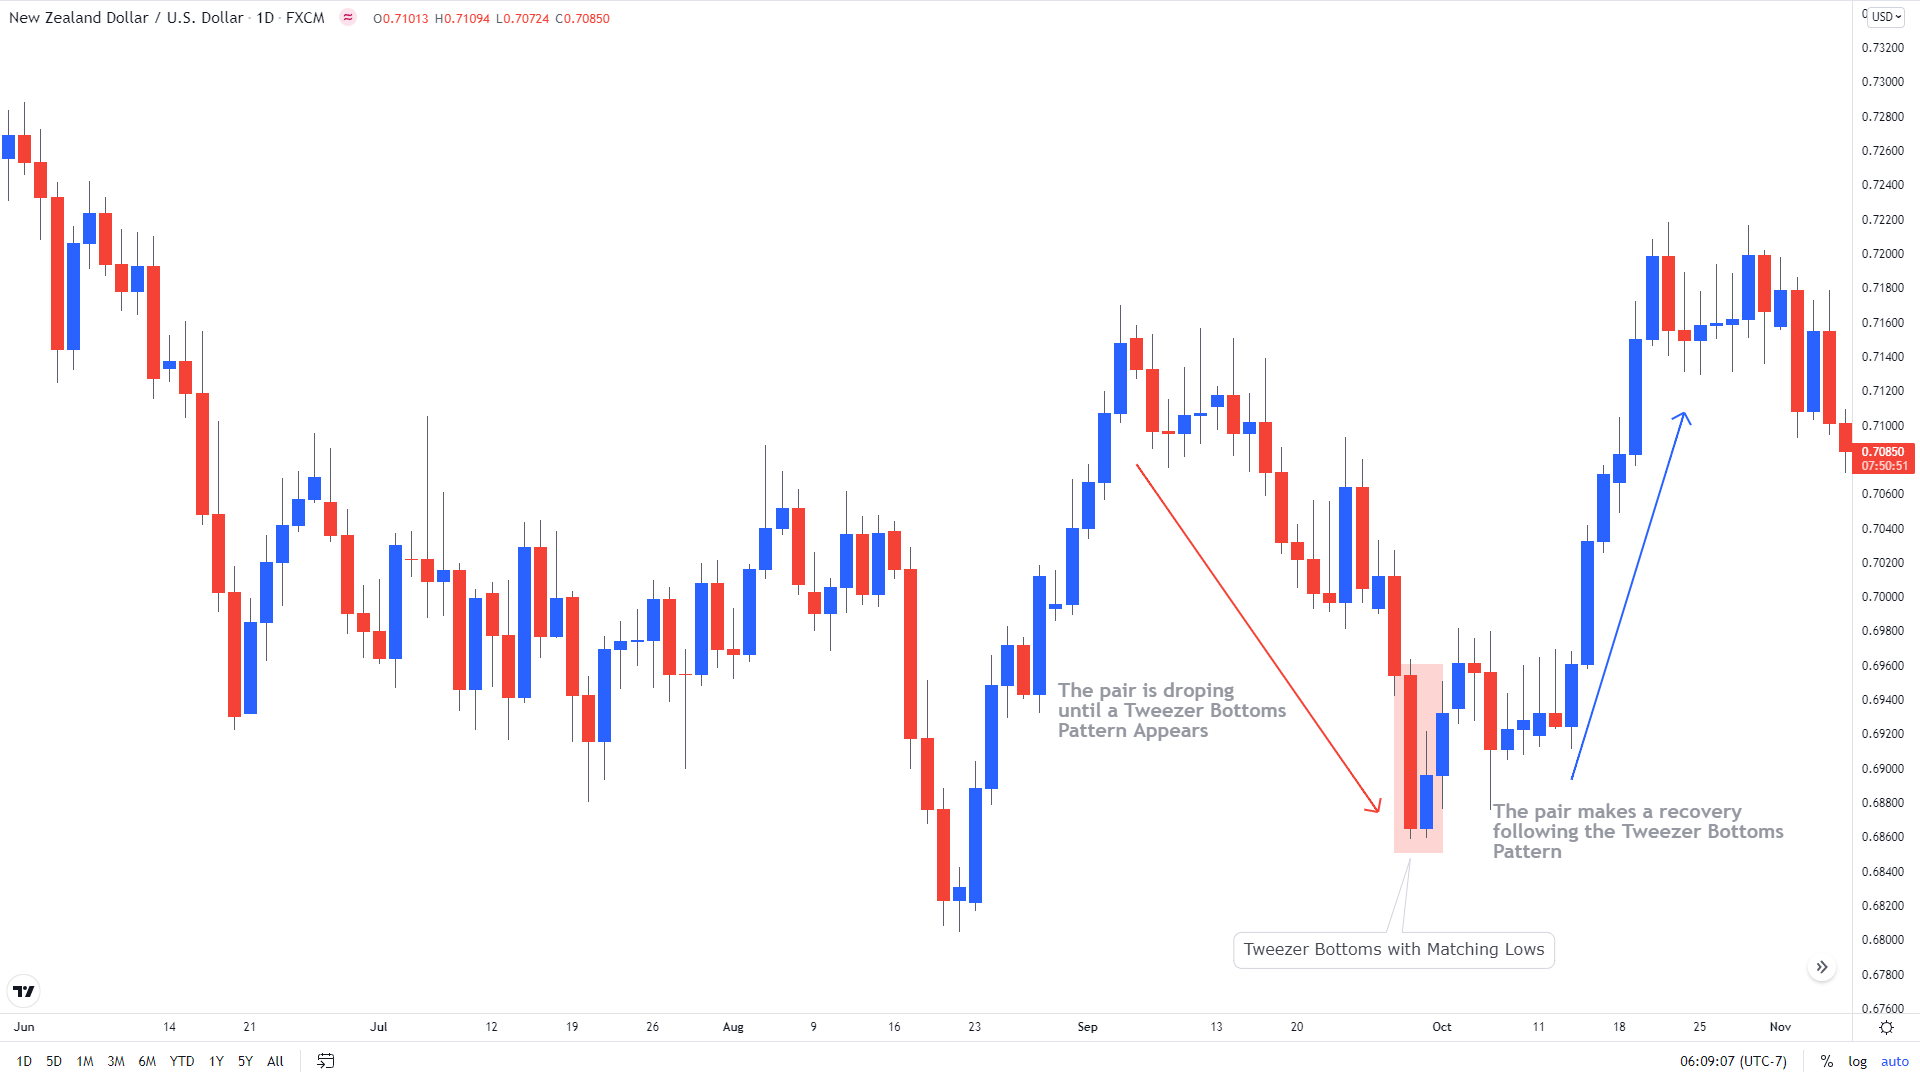
Take a look at the following NZD/USD chart on which the pair is trending lower from 0.7160. After falling nearly 200 pips a Tweezer Bottoms pattern emerged around 0.6850. The first candlestick in the pattern is bearish and has a big real body. The second candlestick in the pattern is bullish and both the candlesticks have matching lows which complete the pattern and a bullish reversal is indicated. Soon in the next session, the pair starts to recover and gradually moves towards 0.7200.
Note:
Tweezer Tops and bottoms are not believed to be strong reversal patterns.
However, if these patterns appear after a long move, and the second candlestick
in the pattern turns out to be a Doji, Hammer, or a shooting star the pattern
is then considered stronger.