Hanging Man Pattern
Hanging man is also a bearish reversal pattern, however, it is not considered a strong reversal pattern. The Hanging Man Pattern has a long lower wick with a small real body at the top and a very small or no upper wick at all. The color of the candlestick is not important however, the size of the lower wick needs to double the size of the real body.
The shape of the pattern reveals that the bears managed to take the market lower but the bulls pushed it back however, they failed to close above the previous closing.

Note: The Hanging Man shape is the same as a Hammer Pattern and they should not be confused. The Hammer Pattern is valid in a downtrend while the Hanging Man is valid in an uptrend.
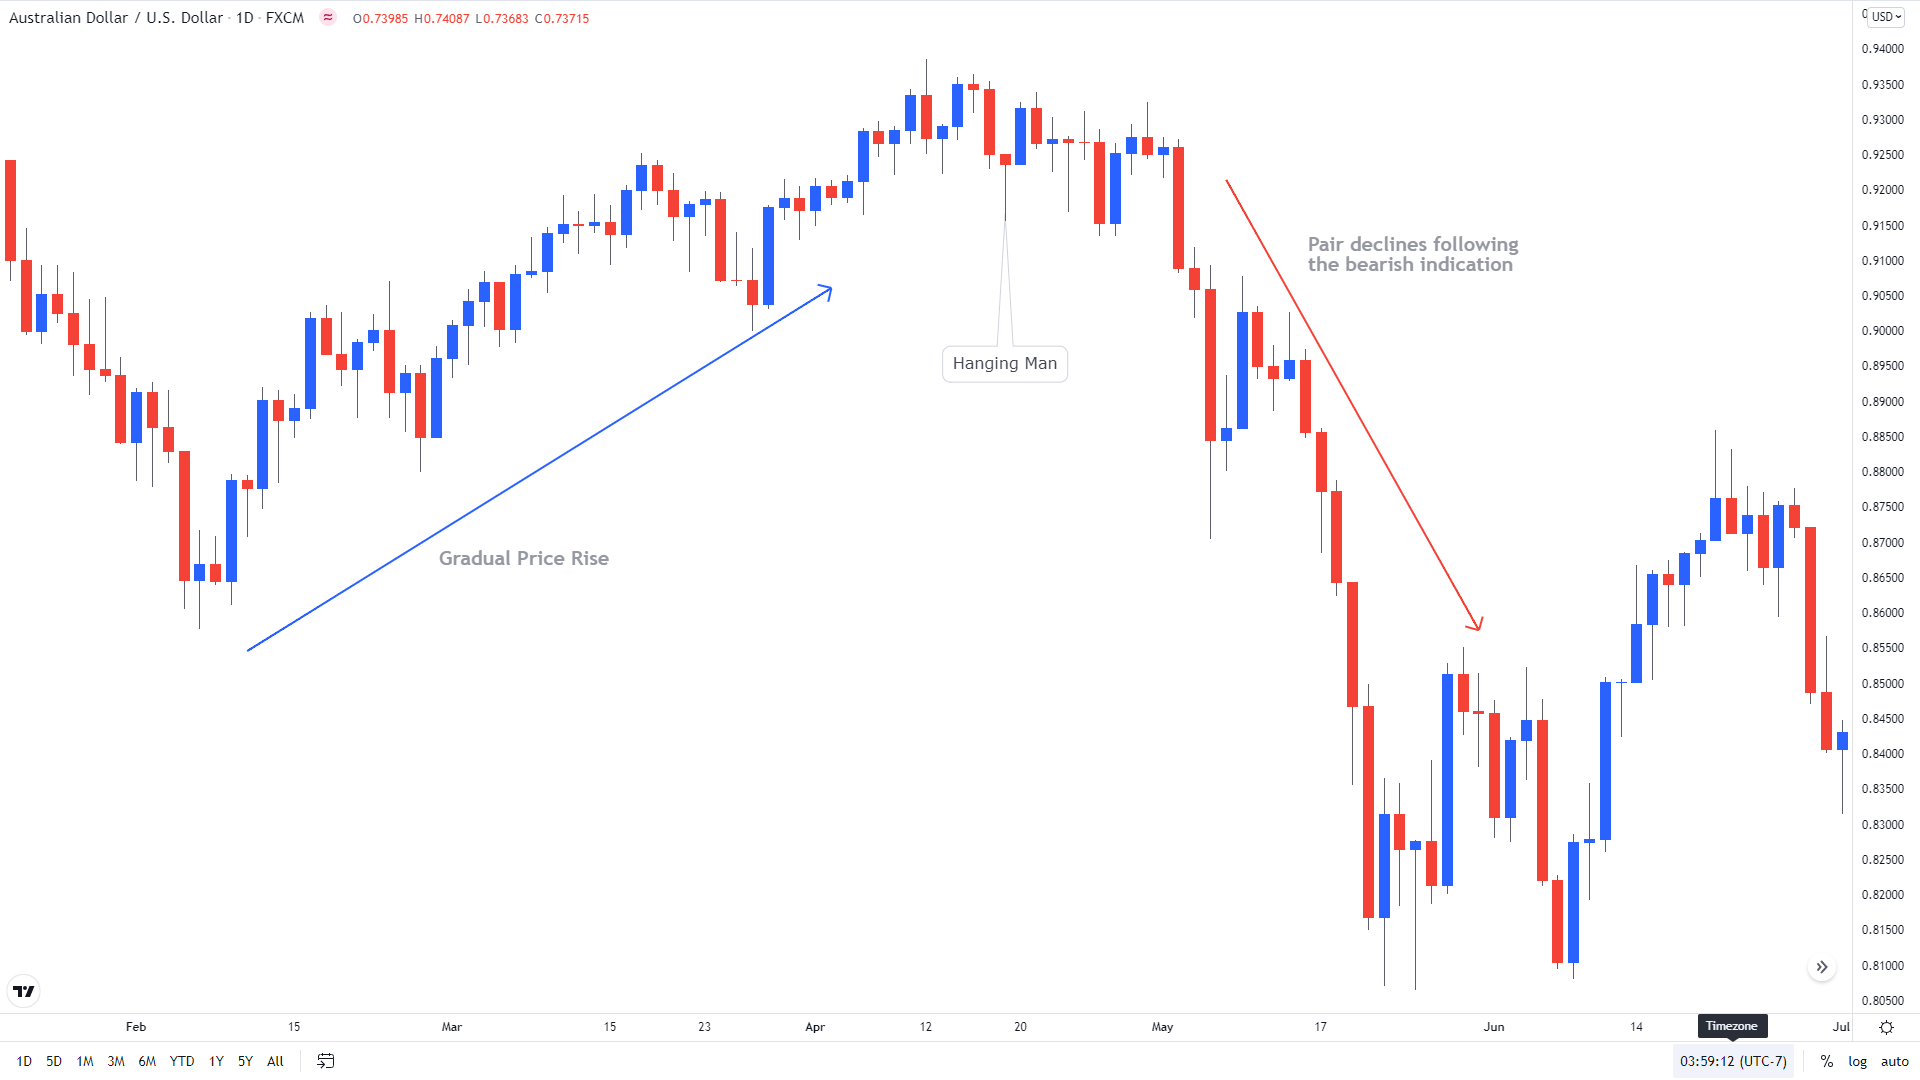
In the below example of AUD/USD, you can see the Hanging Man candlestick gave an early indication of a bearish reversal. The AUD/USD was rising from 0.8600 and after a significant upwards rally a Hanging man pattern appeared near 0.9300. It’s a bearish candlestick with a long lower wick and a small real body at the top. In the next few sessions, several other bearish candlestick patterns also emerged which eventually led to a huge drop towards 0.8150.