Shooting Star Pattern
Candlestick patterns are versatile as they not only indicate bullish reversals but also bearish reversals. The Shooting Star pattern is ideal for spotting a bearish reversal. The pattern is made up of one candlestick that has a long upper wick and a small real body at the bottom. The lower wick is either very small or does not exist at all. The color of the candlestick has no significance however, the size of the upper wick should be double the size of the real body.
The Shooting Star pattern indicates a tug of war between the market forces in an uptrend. The long upper wick shows that the buyers attempted to take the market further higher but the bears grew stronger and now a reversal is on the cards.

Note: The shapes of the Shooting Star and the Inverted Hammer are the same and should not be confused. This pattern is valid only in the uptrend while the Invert Hammer Pattern is valid in a downtrend.
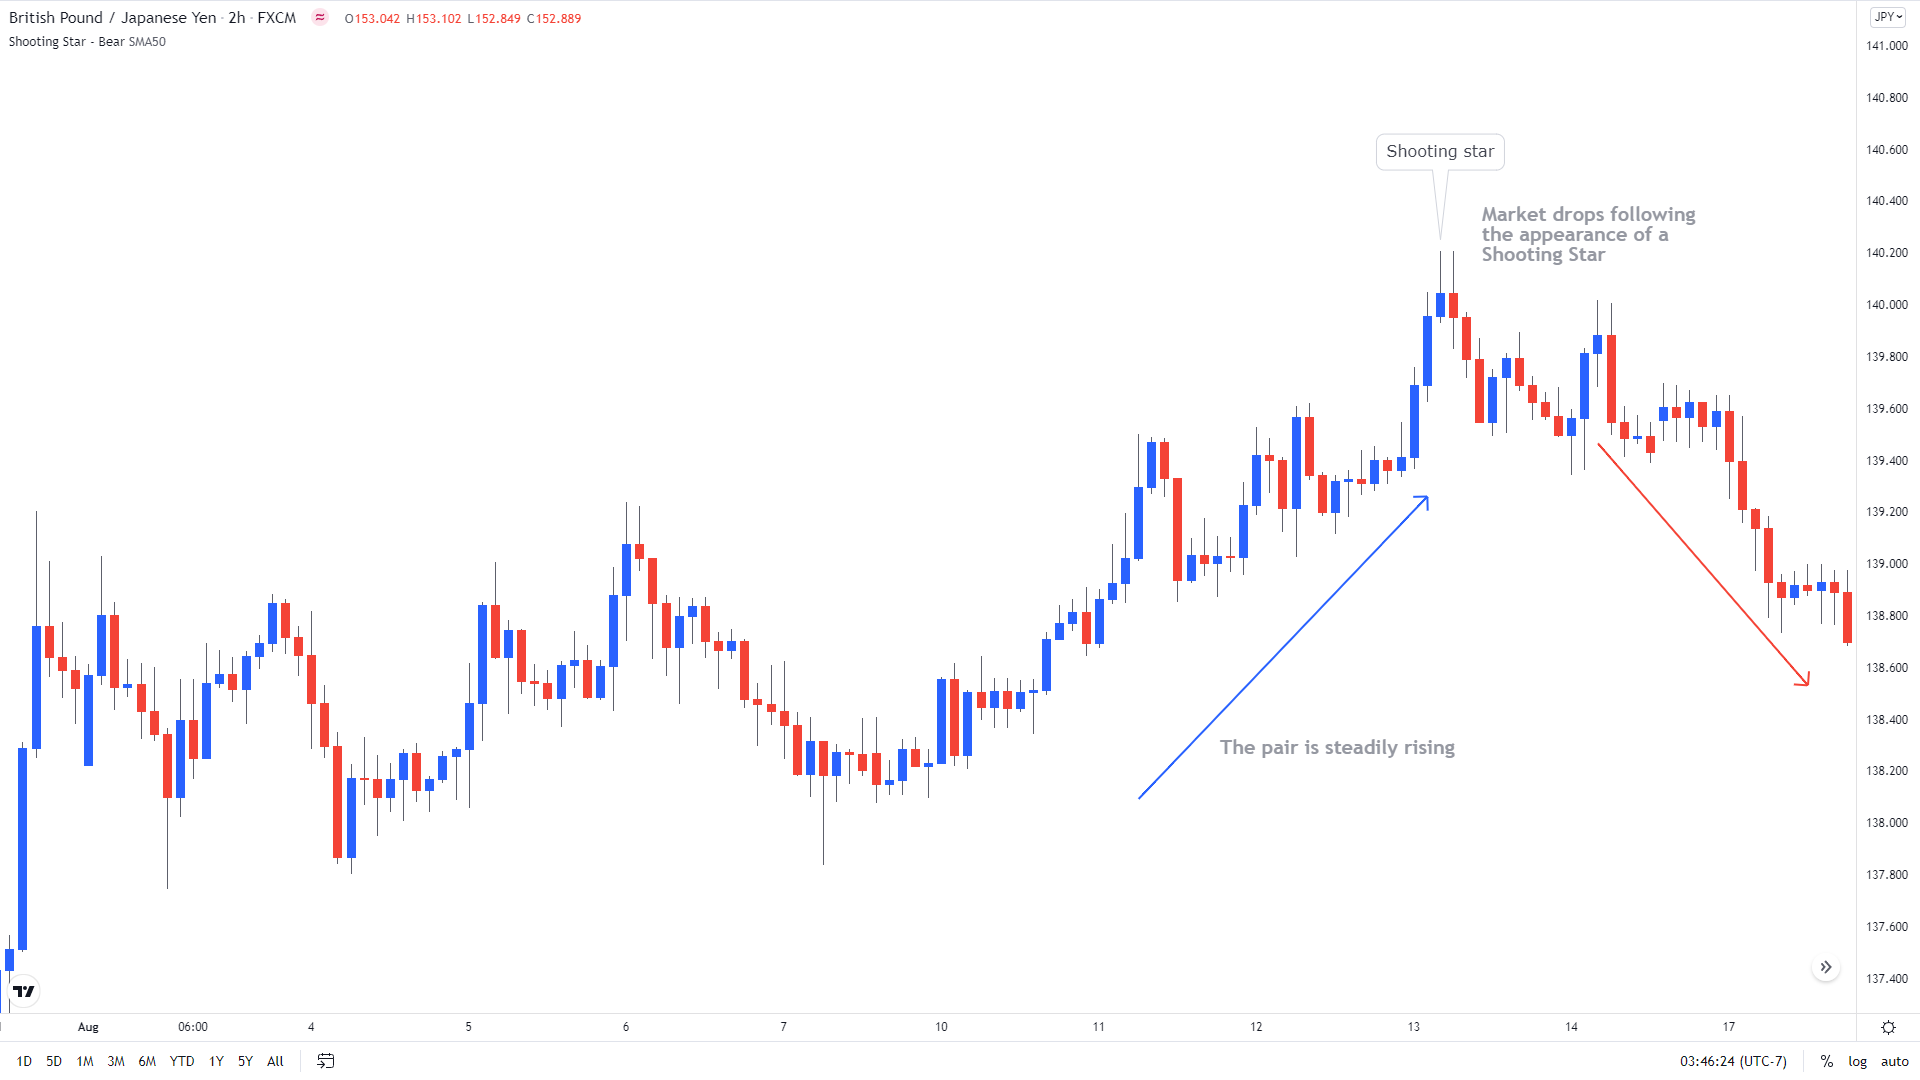
The below chart is an example of the GBP/JPY pair that was steadily rising from 138.00 until a shooting star pattern appeared around 140.00. The pattern indicated a bearish reversal and soon in the next session, a bearish Doji also appeared that further confirmed the signal. Following the bearish signal, the trend reversed and the pair dropped towards 138.70.