Harami Patterns
Harami Patterns are the reversal patterns that frequently appear in a trending market. The patterns are comprised of two candlesticks. The first candlestick in this pattern has a large real body. The second candlestick has a small real body and it remains contained within the real body of the first candlestick.
There are mainly three types of Harami Patterns which are Bullish Harami Pattern, Bearish Harami Pattern, and, Harami Crosses. So let’s explore these patterns one by one.
Bullish Harami Pattern
As the name says the Bullish Harami is a bullish reversal pattern meaning that the falling price may stop and change its direction. The pattern is made up of two candlesticks the first candlestick is bearish and has a big real body. The second candlestick can be of any color but it remains small enough to be contained within the body of the first candlestick.

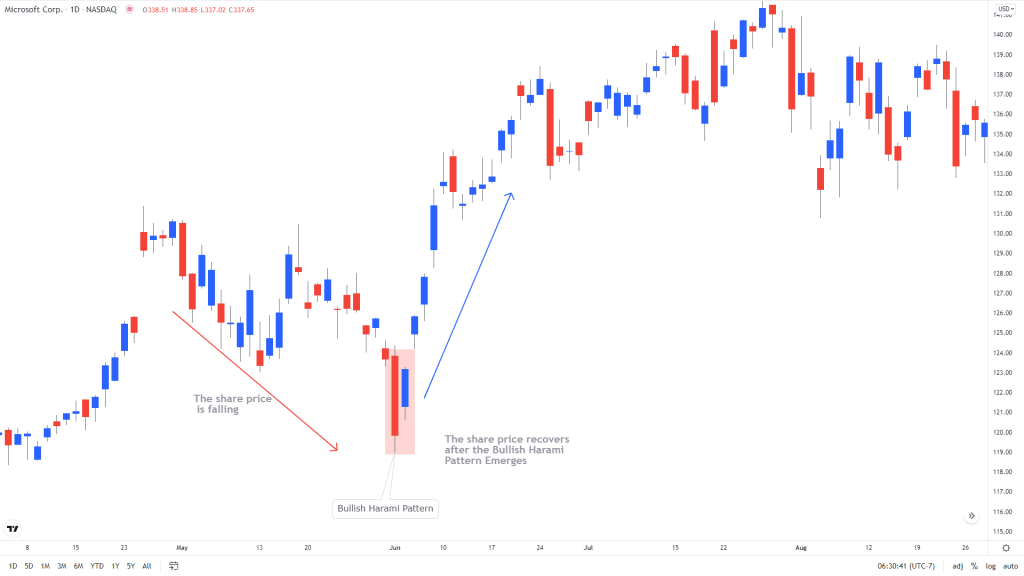
Let’s look at the Microsoft stock chart below. The price of the stock was falling until a Bullish Harami Pattern appeared at the bottom. The first candlestick in the pattern has a large red real body while the second candlestick is small and its opening and closing are contained within the body of the first candlestick. The pattern indicated a bullish reversal and soon after the stock price started to recover.
Bearish Harami Pattern
Bearish Harami is exactly the opposite of the Bullish Harami pattern as it indicates a bearish reversal. The first candlestick in this pattern is bullish and has a large real body. The second candlestick in the pattern has a small real body that remains contained within the body of the first candlestick. The Bearish Harami Pattern indicates that bulls are losing control and the uptrend is likely to reverse.

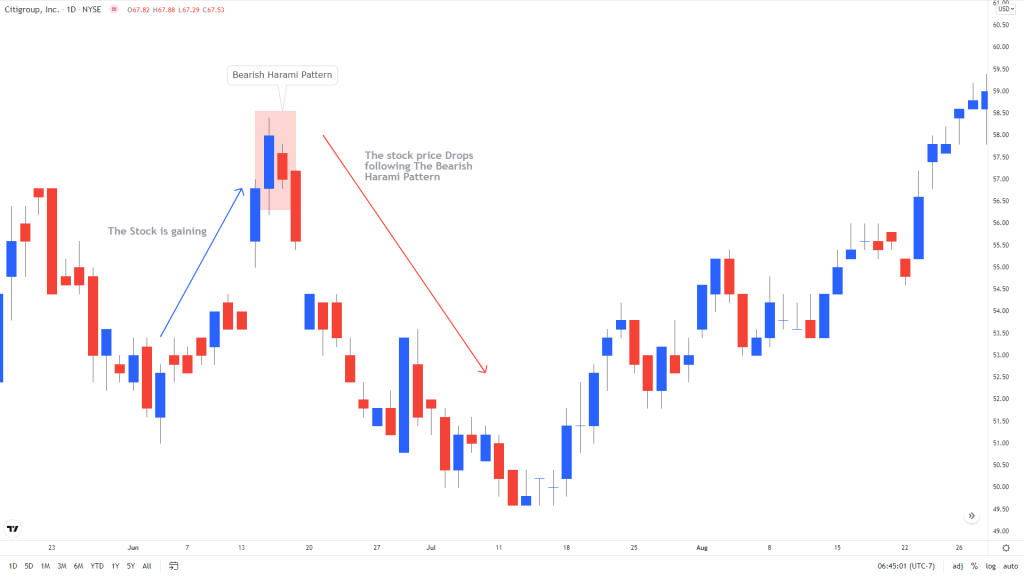
To further understand the Bearish Harami Pattern, let’s take an example of the Citigroup chart below. The stock was recovering from an earlier drop when a Bearish Harami Pattern emerged around $58.50. The first candlestick in the pattern is bullish and it has a large real body. The second candlestick is small and is contained within the body of the first candlestick. Following the pattern, the recovery stopped and the stock once again started to move lower.
Harami Crosses
Harami Crosses are similar to other Harami patterns as they also indicate a possible trend reversal. These patterns can appear in both the up-trending and down-trending markets. A Harami cross Pattern that indicates a bearish reversal is called a Bearish Harami Cross while a Harami Cross that indicates a bullish reversal is called a Bullish Harami Cross.
Harami crosses are like other Harami Patterns, the only difference is that the second candlestick in Harami crosses is a Doji candlestick. The color of the second candlestick (Doji) is not important.
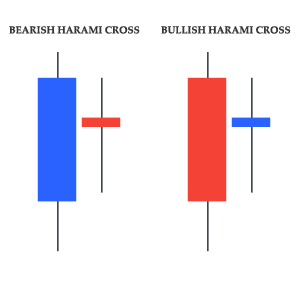
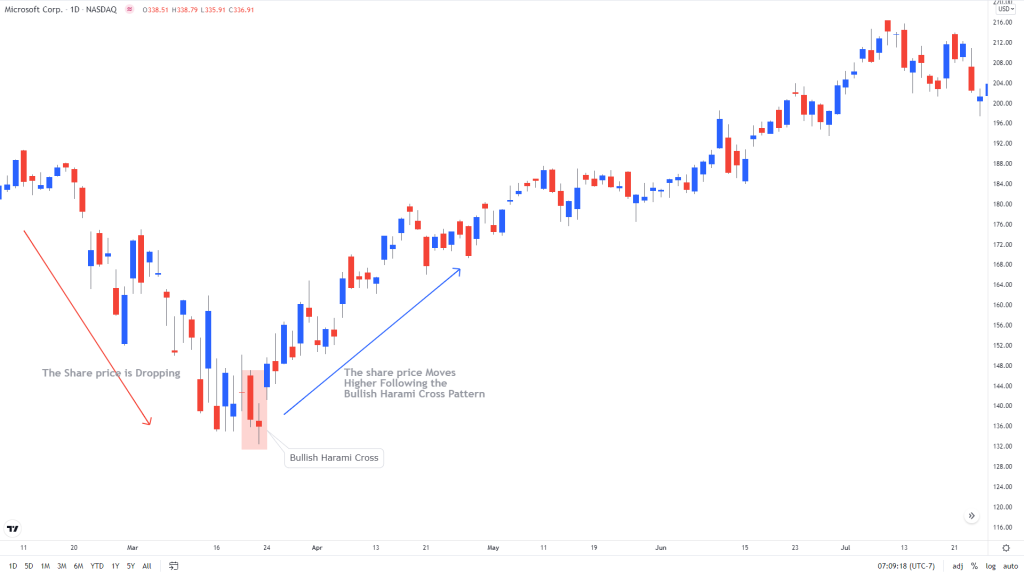
The following Microsoft chart is an excellent example of a Bullish Harami Cross. The stock price had been falling from $192 and after a significant drop to $130 a Bullish Harami Cross emerged. The first candlestick in the pattern has a large real body while the second candlestick is a Doji which confirmed the pattern and signaled a bullish reversal. Following the bullish signal, the stock made a significant recovery towards $200.
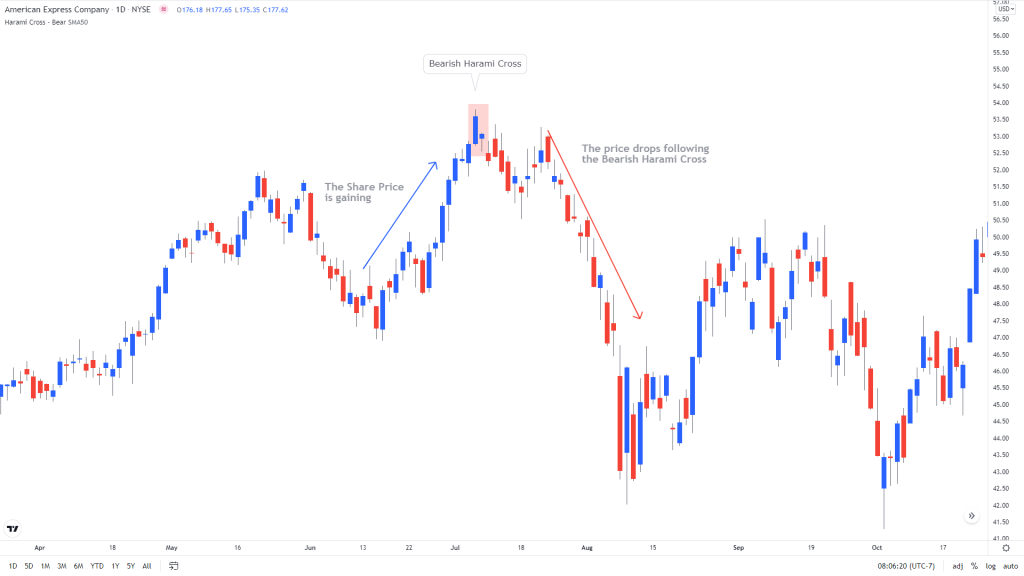
The following chart of the American Express Company shows the significance of the Bearish Harami Cross Pattern. The stock had been rising from $45 with some small correction. However, after rising to $54, a Bearish Harami Cross emerged. The first candlestick in the pattern is bullish and has a large real body. The second candlestick in the pattern is a Doji that is confirming the pattern. Following the bearish indication, the stock price started to fall and found some support only around $42.

