History of Japanese Candlestick Charts & Patterns
The Japanese candlestick chart is one of the oldest and most widely used charting systems. The chart uses rectangle-shaped candlesticks to show the price movement of a financial instrument over a selected period. This charting system was invented in Japan and is highly useful for analyzing any market including Forex, stocks, commodities, and indices. A candlesticks chart offers a quick and easy way to visually analyze the market as compared to the western technical tools that require complex mathematical formulas.
The Invention of Candlestick Charts
Japanese Candlestick analysis is said to be the oldest form of technical analysis. The method was invented by Munehisa Homma, a Japanese rice farmer born in the early 1700. His family had vast rice plantation fields and was engaged in the trading of agricultural commodities. Following his father’s death, Munehisa took control of the family business. Around this time, a rice exchange was established in Munehisa’s city. The exchange is believed to be one of the first commodity exchanges in the world. Munehisa started to trade on the exchange and carefully observed the market behavior. He traded for several years and noticed the price patterns that regularly emerged.
To use this knowledge to his advantage, Munehisa began to analyze the opening, closing high and low numbers of the market. He put the numbers on the paper which formed the shape of a candlestick. It is believed that it was the beginning of the candlesticks chart. In his quest to understand the market behavior, Munehisa discovered several unique candlesticks formations which are now called the Japanese Candlesticks patterns. Using the newly discovered trading techniques, Munehisa became a very successful trader. He is said to have written the world’s first two books on technical analysis. Munehisa became a legend and his method became the way of trading in Japan.
This was a brief history of the Japanese Candlesticks chart, let’s now understand how the actual candlestick is constructed, what sort of patterns the candlesticks form, and what information they provide to the traders.
How Candlestick is Constructed
A candlestick is constructed using the market open, close, high, and low. It has a rectangle shape and two vertical lines above and below it. The rectangle shape represents the range between the open and close and is called the real body of the candlestick. The size of the real body is relative to the range of open and close. The vertical lines represent the high and low and are called the wicks, shadows, or hairs.
A candlestick that closes above the closing of the previous candlestick is known as a bullish or positive candlestick. In other words, it shows the market has risen in that particular period. Similarly, a candlestick that closes below the closing of the previous candlestick is known as a bearish or negative candlestick. It ultimately shows that market has fallen in that period.
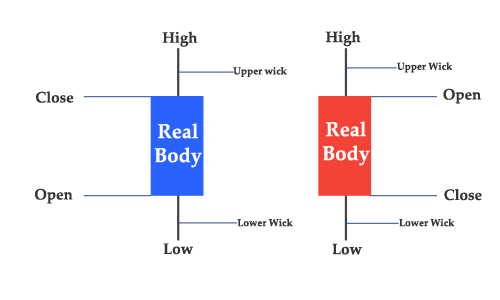
Note: In black and white charts the color of a bullish candlestick is white while the color of a bearish candlestick is black. In modern-day trading platforms, the default scheme is usually green and red. However, almost all the trading platforms let you change the color scheme according to your needs.
What Information Candlestick Chart Provides?
Japanese Candlesticks chart provides visual information of the price movement which is very easy to read. Basically, a candlestick represents the tug of war between the market forces, or in simple words, it shows the delicate balance between supply and demand.
Each candlestick in the chart contains the complete information of the price action for the selected timeframe. For example, if you select the 30 minutes timeframe the candlestick will show the entire price movement that took place in those 30 minutes. Similarly, if you select a higher timeframe like the 4-hour or above the candlestick will show the entire price movement for that period.
According to the candlesticks analysis, the two most important prices are open and close. The reason behind that those are the two most emotional times that overshadow the traders with greed and fear. This is the reason traders pay extra attention to the opening and closing price of the market.
The candlesticks form different shapes and patterns that have different meanings as well. For example, a bullish candlestick with a big real body indicates that the buyers are in control. Likewise, a bearish candlestick with a long real body indicates the bears are in control. A candlestick with a long upper wick and a small real body indicates the buyers attempted to take the price higher but failed.
Japanese Candlestick Patterns
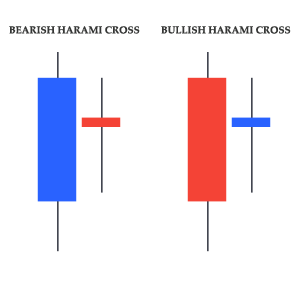
The candlesticks not only provide information in isolation but also form unique patterns. These patterns are one of the most reliable methods of technical analysis. The beauty of the candlestick pattern is that even a single candlestick pattern can indicate market behavior. You can use these patterns to trade Forex, stocks commodities, or any other financial market.
Candlesticks form single-line patterns and multiple line patterns and they indicate the trend reversal as well the continuation of the trend. This course will cover the single, double, and triple candlesticks patterns. You will learn to identify and trade using these patterns. You will also learn the rationale behind these patterns and their implications on the market.


Introduction To the West
The west largely remained unaware of the Japanese Candlesticks until the 1980s. The line chart and the bar chart had always been more popular among the western trades. In the early 1980s, Steve Nison, a stockbroker who worked at Merrill Lynch met a Japanese broker and overheard him using terms like Doji, Morning Star, and so forth. Steve had never heard of these terms and developed an interest. He started researching Japanese candlesticks and was truly impressed by the history and the information the candlesticks chart provided for the analysis.
Steve Nison continued to learn more about the candlesticks chart and the unique candlestick patterns. He realized that the candlesticks patterns provide an excellent opportunity to predict the future price movement of the market. He was so intrigued and started introducing the candlesticks chart to the western world. He wrote several books and lectured in the universities. Steven Nison became popular in the west and was awarded the Chartered Market Technician (CMT) designation. Thanks to Steven Nison, today the candlesticks charting system is more popular in the west than ever before.