

Have you ever felt that the Forex or stock markets are like an encrypted code you can’t crack? Well, you’re not alone! This candlestick patterns cheat sheet will be a decoder for you.
What’s Included in This Candlestick Patterns Cheat Sheet?
This candlestick patterns cheat sheet includes some of the most reliable single, double, and triple candlestick patterns including Doji, Hammer, Shooting Star, Bullish, and Bearish Engulfing Patterns. But what exactly are candlestick patterns, and how can they help you in your trading? Let’s first find out everything about candlestick patterns.
What are Candlestick Patterns?
The History of Candlestick Patterns
The history of candlestick patterns dates back to 18th century Japan, where they were developed for the rice trade. The credit for their development often goes to a legendary Japanese rice trader named Munehisa Homma. Homma realized that while there was a fundamental connection between supply and demand and rice prices, the market was also heavily influenced by the traders’ emotions, such as fear, greed, and hope. This insight led him to analyze the market’s psychological aspects reflected in the price movements and patterns.
These early candlestick charts and patterns went to the Western world much later. It wasn’t until the late 20th century that they became widely known and used in Western trading circles, primarily due to the efforts of Steve Nison. Nison introduced these methods to Western traders through his book Japanese Candlestick Charting Techniques. His work detailed how candlestick patterns could be used with other technical analysis and trading strategies.
Why Use Candlestick Patterns?
Well, for one, they provide a visual summary of price movements. You can understand where the market is heading at one glance. Plus, these patterns can indicate potential trend reversals, giving you a heads-up on potential trading opportunities. It’s like getting a cheat sheet for a test! Here are some of the reasons why you should use candlestick patterns.
Visual Insight: You can quickly highlight the market sentiment and potential reversals.
Price Action Analysis: Candlestick patterns focus on raw price movements and are not a lagging indicator.
Entry and Exit Points: You can use candlestick patterns to Identify key levels to enter and exit trades
Risk Management: You can use the pattern to set stop-loss and take-profit levels.
Pattern Recognition: Using these patterns, you can quickly identify market trends and behaviors.
Historical Reliability: These Patterns have been used and tested for centuries.
Confirmation Tool: You can use the pattern to support other technical analysis methods and tools for better decisions.
Market Psychology: Candlestick patterns always reflect traders’ emotions and market psychology.
Essential Candlestick Patterns
Now you know why you should use candlestick patterns in trading. There are several patterns, but we’ll focus on the most important ones. Let’s jump into this candlestick patterns cheat sheet and discover everything.
Single Candlestick Patterns
These are patterns formed by just one candle.
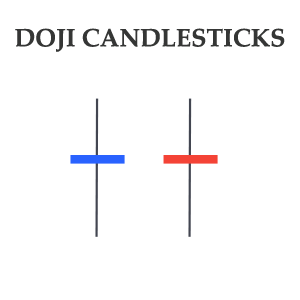
Doji
A Doji is characterized by its unique shape, where the opening and closing prices are almost equal. A Doji candlestick looks like a cross or plus sign. It has a thin line and a small body. The thin line represents the range between the high and low prices. The small body forms due to the nearly identical opening and closing prices. The Doji is often decoded as a sign of indecision or balance between buyers and sellers.
Hammer
Moving on with our candlestick patterns cheat sheet. The hammer is an important candlestick pattern to identify potential reversals in price trends. A Hammer candlestick has a small body at the top with a long lower wick and little or no upper wick. It is typically considered a bullish reversal pattern. It forms when the price moves lower than its opening but returns to close near the opening price. This pattern suggests that the selling pressure was initially strong but was overcome by buying pressure, indicating a potential change in sentiment from bearish to bullish.

Shooting Star
The Shooting Star is a bearish candlestick pattern and signals a potential reversal of an existing uptrend. It has a small lower body, a long upper wick, and little or no lower wick. The long upper wick represents a significant price increase that wasn’t sustained, leading to a close near the open. This pattern is considered bearish because it indicates that the buyers could push the price up but were ultimately overpowered by sellers, pushing the price back down near the opening level.

Double Candlestick Patterns
These patterns need two candlesticks to form.
Bullish and Bearish Engulfing
Bullish and Bearish Engulfing patterns are well-known candlestick patterns to identify trend reversals. A bullish engulfing pattern occurs in a downtrend and is formed by two candlesticks. The first candlestick is bearish. The second candlestick is followed by a larger bullish candlestick that completely engulfs the first candle’s body. The pattern suggests that the buying pressure overtakes the selling pressure, and traders take it as a buy signal.
On the other hand, the bearish engulfing pattern forms an uptrend. It consists of a small bullish candlestick, which follows a larger bearish candlestick that completely engulfs the first candle’s body. The bearish Engulfing pattern signifies a potential reversal from a bullish to a bearish trend, and traders take it as a sell signal.


Dark Cloud Cover
The Dark Cloud Cover is a bearish reversal pattern. It consists of two candlesticks. The first candlestick is a long bullish candle, while the second is a bearish candlestick that opens above the closing of the first candle. The closing of the second candlestick within the body of the first candlestick, despite a higher opening, suggests a shift in sentiments from bullish to bearish. Traders take this as a sell signal.

Triple Candlestick Patterns
Three’s a crowd, but not here! These patterns are made of three candlesticks.
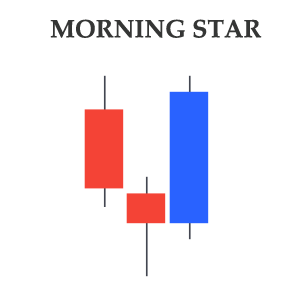
Morning Star and Evening Star
Morning Star and Evening Star typically signal trend reversals. Morningstar is a bullish reversal pattern that occurs at the end of a downtrend. It’s a three-candlestick pattern. The first is a long bearish candle, followed by a small candle (which can be bullish or bearish) that gaps below the first candle. The third is a long bullish candle that closes well into the first candle’s body. The pattern indicates a turning point where the bearish sentiment is ending, and bullish sentiment is starting to take over.
Contrary to the Morning Star, the Evening Star is a bearish reversal pattern. The first is a long bullish candle, followed by a small-bodied candle (which can be bullish or bearish) that gaps above the first candle. The third is a long, bearish candle that closes well into the first candle’s body. This pattern signifies a shift from a bullish to a bearish trend

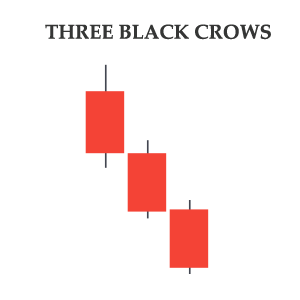
Three Black Crows and Three White Soldiers:
Three Black Crows and Three White Soldiers are also the trend reversal patterns. The Three Black Crows pattern comprises three consecutive long-bodied bearish candlesticks that open within the previous candle’s body and close lower than the previous day. Each candle opens slightly higher or at the same level as the previous one but closes significantly lower. This formation refers to a possible shift in the ongoing uptrend.
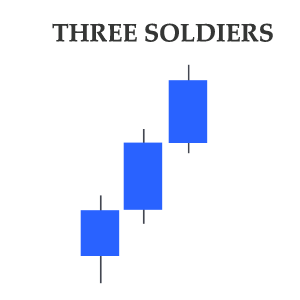
The Three White Soldiers pattern is the bullish counterpart to the Three Black Crows. In this pattern, each candle opens within or above the previous candle’s body and closes higher. This candlestick formation suggests a steady rise in the price and indicates a possible shift in the ongoing downtrend.
Using Candlestick Patterns in Trading
Candlestick patterns alone aren’t the Holy Grail, but they are important to analyze and predict the price movement..
Importance of Volume
When analyzing these patterns, always check the volume. Why? Because high volume can validate a pattern. It’s like getting a second opinion on a diagnosis.
Context Matters
Never base your trade solely on candlestick patterns. Look at the bigger picture. What’s the overall trend? Are there any external factors? Imagine it as puzzle pieces; you need all of them to see the complete picture.
FAQs
Conclusion
Hopefully, this Candlestick patterns cheat sheet can be the Rosetta Stone for you. These candlestick patterns offer insights, show potential trend reversals, and can be the edge you need in trading. But remember, always look at the bigger picture and never trade based on a single pattern. And if you want to learn more, take our free course on Japanese Candlestick Patterns.
