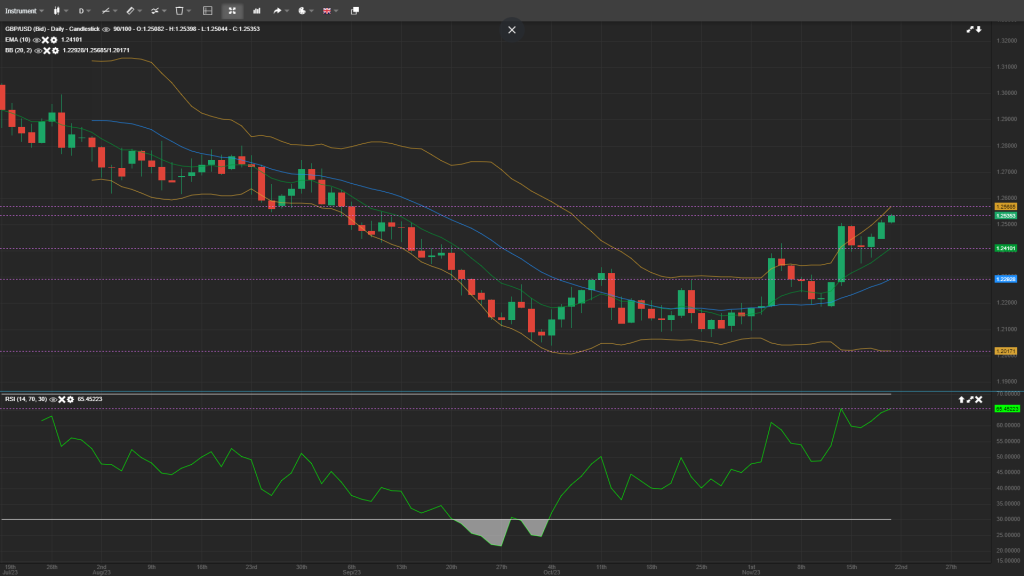
The GBP/USD pair maintains a bullish intraday bias, as its ascent from a slightly adjusted base of 1.2040 continues. The current upward trend is expected to target the 61.8% Fibonacci retracement level, which, after adjustment, is at 1.2720, calculated from the range of 1.3145 to 1.2040. A break below the modified support level at 1.2376 would be necessary to suggest a short-term peak. Absent this, the pair is likely to sustain its rally, even in the event of a temporary pullback.
Expanding to a larger scale, the price movements of GBP/USD since the high of 1.3145 are interpreted as part of a corrective pattern that originated from the 2022 low, now revised to 1.0355. The strong rebound from the 38.2% Fibonacci retracement level of this range, now at 1.2079, reinforces the view that the current rise from 1.2040 constitutes the second phase of this pattern. Although further upward movement is anticipated, the rally is expected to encounter a ceiling at 1.3145, setting the stage for the development of the third phase in the corrective pattern.
Analysis Summary
The GBP/USD pair’s current rally from 1.2040 is eyeing the 1.2720 level, with support at 1.2376 crucial for short-term trends. This rise is part of a larger corrective pattern, with the rally expected to be capped at 1.3145, heralding the next pattern phase.
Key Points
- GBP/USD targets 1.2720 in the ongoing rally.
- Crucial support at 1.2376 for short-term trend analysis.
- A broader pattern suggests a cap at 1.3145.


