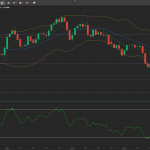
USD/JPY bulls are having stiff resistance near 114.00. A Doji and hammer pattern are indicating a strong indecision period with the pair currently trading at 113.97. The intraday resistance levels are at 114.00 and 114.44. The near-term support levels are at 113.71 and 113.44.
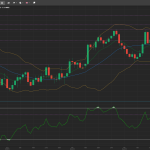
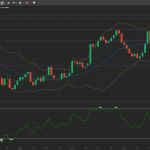
On the intraday charts, the current price is near the SMA-14 resistance line which is 113.96. The SMA-50 is indicating support way below at 111.62. The RSI is at 50 and now appears flat while the MACD is above the middle line. Following the intraday price pattern, the pair is presenting opportunities on both sides. However, the buy entry using the following levels is subject to the condition that the pair closes above the 114.00 mark on the 4-hourly chart. The target for this trade will be 50 to 60 pips with a stop-loss at 113.70
On the flip side, failing to close above the 114.00 level favors selling entries around 113.85 with a target of 113.85 and a stop-loss at 114.15.