GBP/USD Daily Analysis
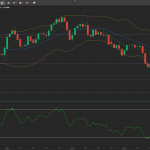
GBP/USD is trading in a narrow range for the past couple of sessions. However, the intraday bias remains bearish with immediate resistance levels at 1.3026 and 1.3059. The intraday support levels are at 1.2977 and 1.2955.
The technical indicators are presenting a bearish picture. The SMA-14 resistance line is at 1.3059 and the SMA-50 resistance area is at 1.3236. The contracting Bollinger bands are indicating a possible squeeze that may lead to a bigger move in the coming session. The RSI is at 39 and appears flat. Following the current intraday price pattern, a sell entry will only be ideal if the pair breaks below the 1.2980 support line on the 4-hourly chart. The intraday target for this trade will be 50 to 60 pips while a reasonable stop-loss will be at 1.3025.
On the flip side, a buy entry would be ideal if the pair breaks above the 1.3050 resistance. The target for this trade would be 40 to 50 pips while a reasonable stop-loss for this trade will be near the 1.3010 level.