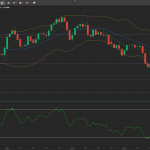
Gold’s price is entering a correction phase following the two weeks bullish momentum. The yellow metal ended the last week at $1845 and is currently trading almost unchanged at $1845.81. The intraday support levels are at $1837 and $1826. The near-term resistance areas are at $1856 and $1869.
On the intraday charts, the RSI is at 59 and appears flat while the MACD is still above the middle line. The SMA-14 is indicating support at $1838 while the SMA-50 support area is way below at $1789. The mid-Bollinger band is at $1824 with upper and lower bands at $1887 and $1762 respectively. The intraday price pattern is now bearish and favors selling entries around $1850 with a target of $1839 and a stop-loss at $1861.