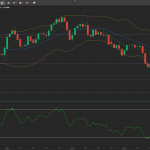
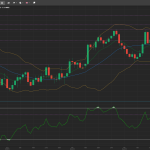
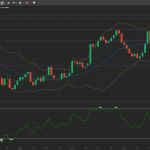
USD/CAD bulls are having stiff resistance around the 1.2600 mark and the pair is currently trading 0.07% lower to 1.2594. The 1.2600 is acting as a major resistance area while other resistance levels are at 1.2624 and 1.2656. The intraday support levels are at 1.2577 and 1.2558.
On the intraday charts, the presence of a Doji at the peak is perhaps an indication of the exhausted bulls. However, the technical indicators are presenting a bullish picture. The SMA-14 support line is at 1.2503 and the SMA-50 support are is at 1.2527. The mid-Bollinger band is at 1.2645 with upper and lower bands at 1.2640 and 1.2288 respectively. Currently, the intraday price pattern is bullish however, the 1.2600 is acting as a stiff resistance area and a buy trade is ideal only if the pair closes above the 1.2600 mark on the 4-hourly chart. The target for this trade will be 50 to 70 pips with a stop-loss at 1.2575.