USD/JPY Daily Analysis
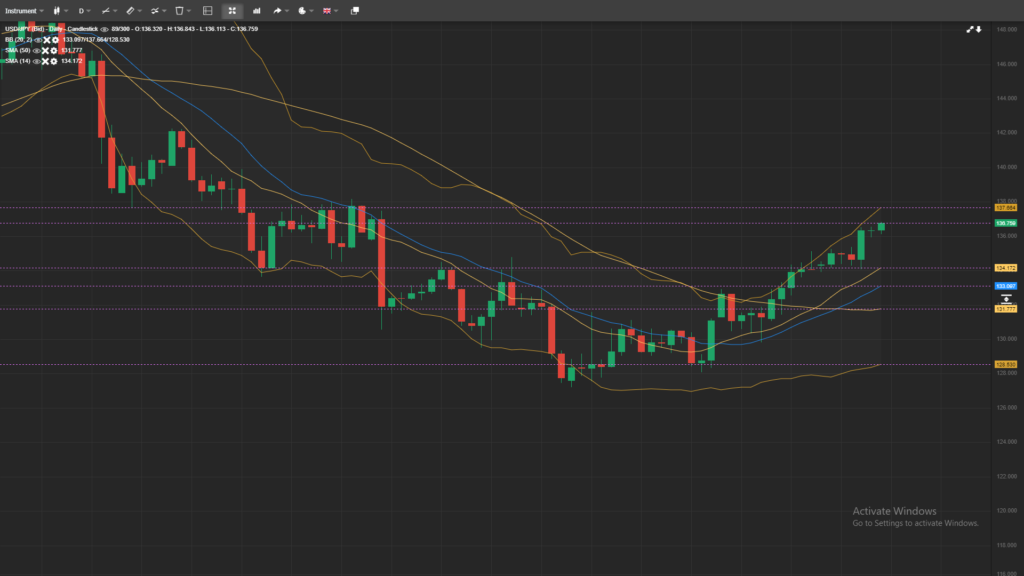
The immediate focus is on the 38.2% retracement of 151.93 to 127.20 at 136.64. If this Fibonacci level is rejected, followed by a break of the 134.04 support, it will suggest that the rebound from 127.20 has completed, and the bias may turn to the downside. However, if there is sustained trading above 136.64, it will indicate that the fall from 151.93 has ended and may bring further rally to the 61.8% retracement at 142.48.
In the bigger picture, the focus is also on the 38.2% retracement of 151.93 to 127.20 at 136.64. A sustained break above this level will indicate that the price actions from 151.93 in the medium-term are just a corrective pattern and will maintain long-term bullishness. On the downside, rejection by 136.64 will extend the fall from 151.93 to the 61.8% retracement of 102.58 to 151.93 at 121.43 at a later stage.


