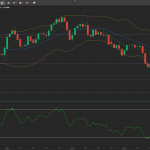
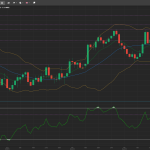
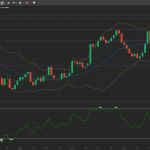
USD/JPY has dropped from the 24 November peak and is currently trading at 114.39. The intraday support levels are 114.11 and 113.75. The near-term resistance areas are 114.61 and 114.89.
On the intraday chart, the SMA-14 is indicating support at 114.23 and the SMA-50 support line is way below at 113.01. The RSI has come down to 54 and has a downwards curve. The MACD is above the middle line however, the histogram is starting to turn bearish. So far the intraday and 4-hourly price patterns are bearish and indicate a further lower move which makes the pair ideal selling entries around 114.45 with a target of 50 to 60 pips and a stop-loss at 114.90.


