Daily Forex Analysis – GBP/USD
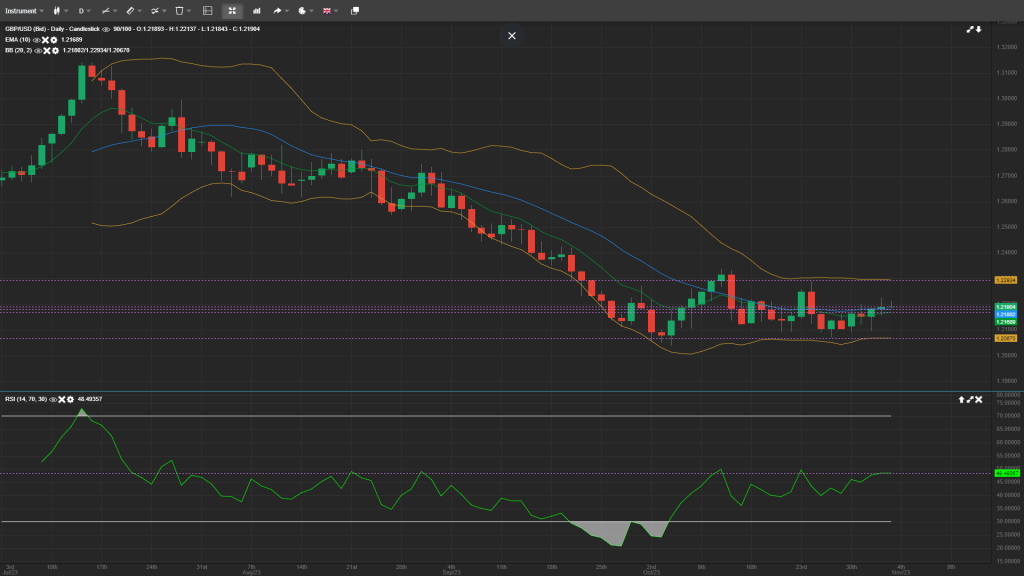
The GBP/USD trading stance currently exhibits a neutral intraday bias. A convincing surge past the 1.2291 mark, a minor resistance point, could signify a renewed upward trajectory from the 1.2040 foundation. Such a move would redirect the intraday bias towards the upside, aiming for the 38.2% Fibonacci retracement level from the peak of 1.3145 down to 1.2040, now positioned at 1.2462. Conversely, an apparent descent below the 1.2040 support level might signal the continuation of the broader pullback from the 1.3145 high, with the next target set at the 1.1805 support zone.
Looking into the broader perspective, the decline from the high of 2022, which was at 1.3145, could merely represent a correction phase within the overarching upward trend that commenced from the 2022 trough of 1.0355. Nevertheless, the possibility of a trend reversal is gaining traction. A persistent breach below the 38.2% Fibonacci retracement level of the upswing from 1.0355 to 1.3145, now adjusted to 1.2079, would set the stage for a potential dip towards the 61.8% retracement level at 1.1421. Currently, the risk remains tilted to the downside as long as the 55-day Exponential Moving Average, presently at 1.2319, is not surpassed on any bullish rebounds.
Analysis Summary
The GBP/USD pair holds a neutral position with the potential to pivot upward if it breaks resistance at 1.2291. However, the risk of a trend reversal looms if the pair fails to stay above key Fibonacci levels, with downside risks prevailing below the 55-day EMA.
Key Analysis Points
- A break above 1.2291 could indicate a resumption of the uptrend from 1.2040.
- A sustained move below 1.2079 would increase the likelihood of reaching the 1.1421 level.
- The 55-day EMA at 1.2319 is the critical threshold for maintaining the downward risk.


