Fibonacci Retracement
Fibonacci retracement is a popular technical tool to analyse and predict the price movement of the financial markets. The tool is based on a sequence of numbers that were identified by Leonardo Fibonacci in the 13 Century.
The sequence starts from 0 and 1. The next number is made up by adding two previous numbers. The sequence goes like 0, 1, 1, 2, 3, 5, 8, 13 till infinity. Leonardo discovered that if a number in the sequence is divided by the number it follows the ratio is always approximately 1.618 or 61.8 percent. The 61.8% is called the golden ratio. There are also other ratios in the sequence like 38.2 percent and 23.6 percent.
These ratios are frequently found around nature. The proportion of the flowering plant and snail shells are very common example. Somehow these ratios also work in the financial markets which has le to the making of the Fibonacci retracement tool. The tool is used to find the retracement levels. Traders then use those levels to place the trades and plan the exits. However before going into further details let’s first understand what is retracement and how it works?
Retracement in the financial market is a small price correction that takes place following a relatively big movement. For example if the price of an instrument is in an uptrend it may fall momentarily only to rise again. This small price correction is called the retracement. Traders use the retracement to their advantage and try to enter the market at a better price while still following the original direction of the trend.
Now the question is how retracement correlates to the Fibonacci? The answer is very simple. The Fibonacci Retracements levels are taken from the Fibonacci sequence. Just like the Fibonacci ratios that are found everywhere they also seem to work in the financial markets. In technical analysis the Fibonacci retracement levels are drawn by choosing two swing points. The commonly used Fibonacci retracement levels are 23.6 percent 38.2 percent 50 percent and 61.8 percent. The 50% is not the Fibonacci ratio but is now widely used with the Fibonacci retracement levels.
How To Draw Fibonacci ?
Fibonacci retracement levels can be drawn in both up trending and down trending markets and drawing the levels is fairly simple. The first step to draw the retracement levels using a trading platform is to identify a trend. Once the trend is identified you need to spot a swing low and a swing high within that trend. Then using the Fibonacci retracement tool you can draw the retracement by connecting those two swing points. [Generally you will get 5 to 6 retracement levels. However the most widely used levels are 38.2 percent 50 percent and 61.8 percent.
It is important to draw the Fibonacci retracement levels correctly. To draw the retracement in an uptrend the line is drawn from the swing low to the swing high. Likewise to draw the retracement in a downtrend the line is drawn from the swing high to the swing low.
How To Trade Using Fibonacci?
To trade using retracement levels in an uptrend the first thing is to analyse whether the price gets some support near the 38.2 percent and 50 percent levels. The confirmation would be when the price touches or drops below the 50% level and then gradually starts moving up. Once you get this confirmation you can place a buy trade between the 38.2 percent and 50 percent retracement levels. The stop-loss will be just below the 61.8 percent retracement level. For the take profit you can either analyse the price action or use another indicator like the rsi.
To trade using the retracement levels in a downtrend the ideal entry level is once again between the 38.2 percent and 50 percent retracement levels. The stop-loss for this trade will be above 61.8 retracement level. For the take profits you can rely on the price action or also use another indication.
There are many theories as to how one can trade using retracement levels. However it is widely accepted among traders that the majority of the retracement completes near the 50 percent level and if the price goes beyond the 61.8% level the trend is considered to have changed permanently.
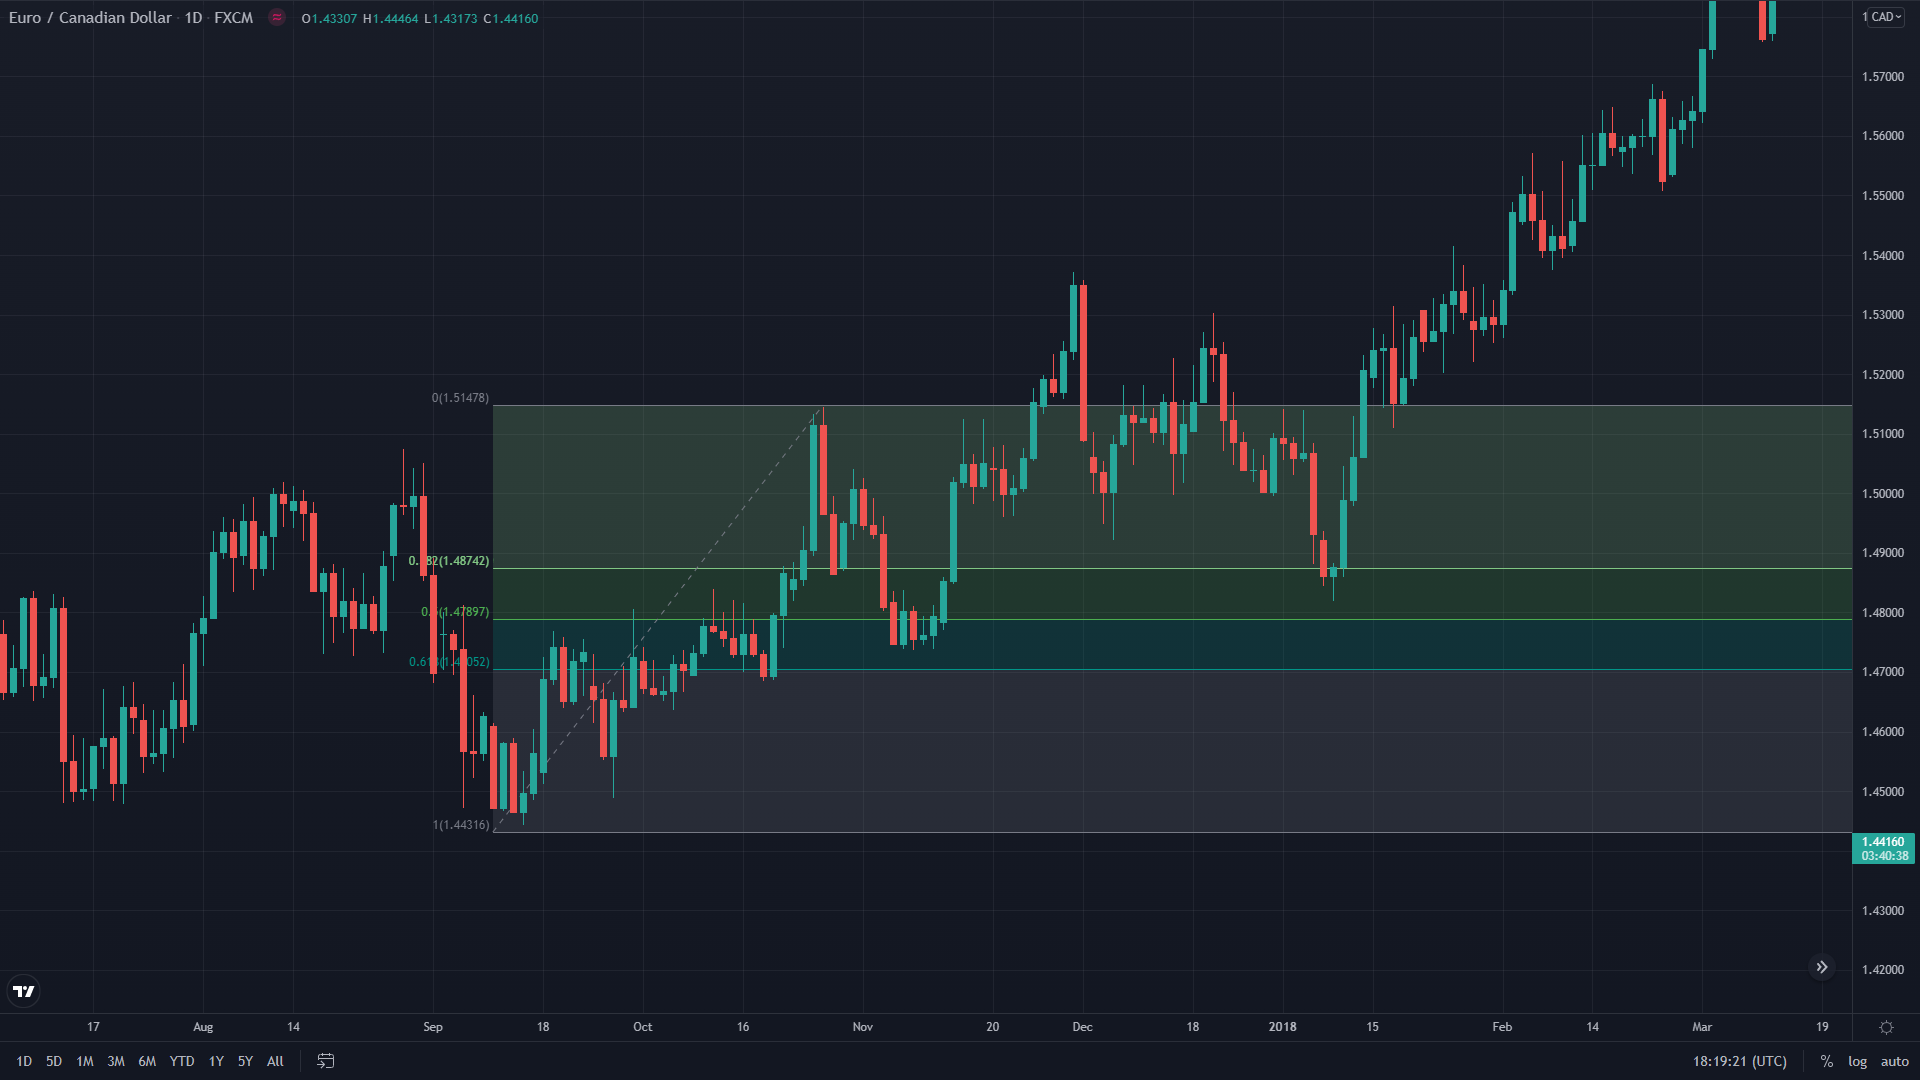
The Following EUR/CAD chart is an excellent example of how the retracement levels work. On this chart the Fibonacci retracement is drawn using the two swing points. Once the pair starts to move lower from the swing high it gets some support around the 38.2 percent retracement level. The price largely remains above the 61.8 percent retracement level. And then after a few session, the price starts to recover and moves higher than the first swing high.
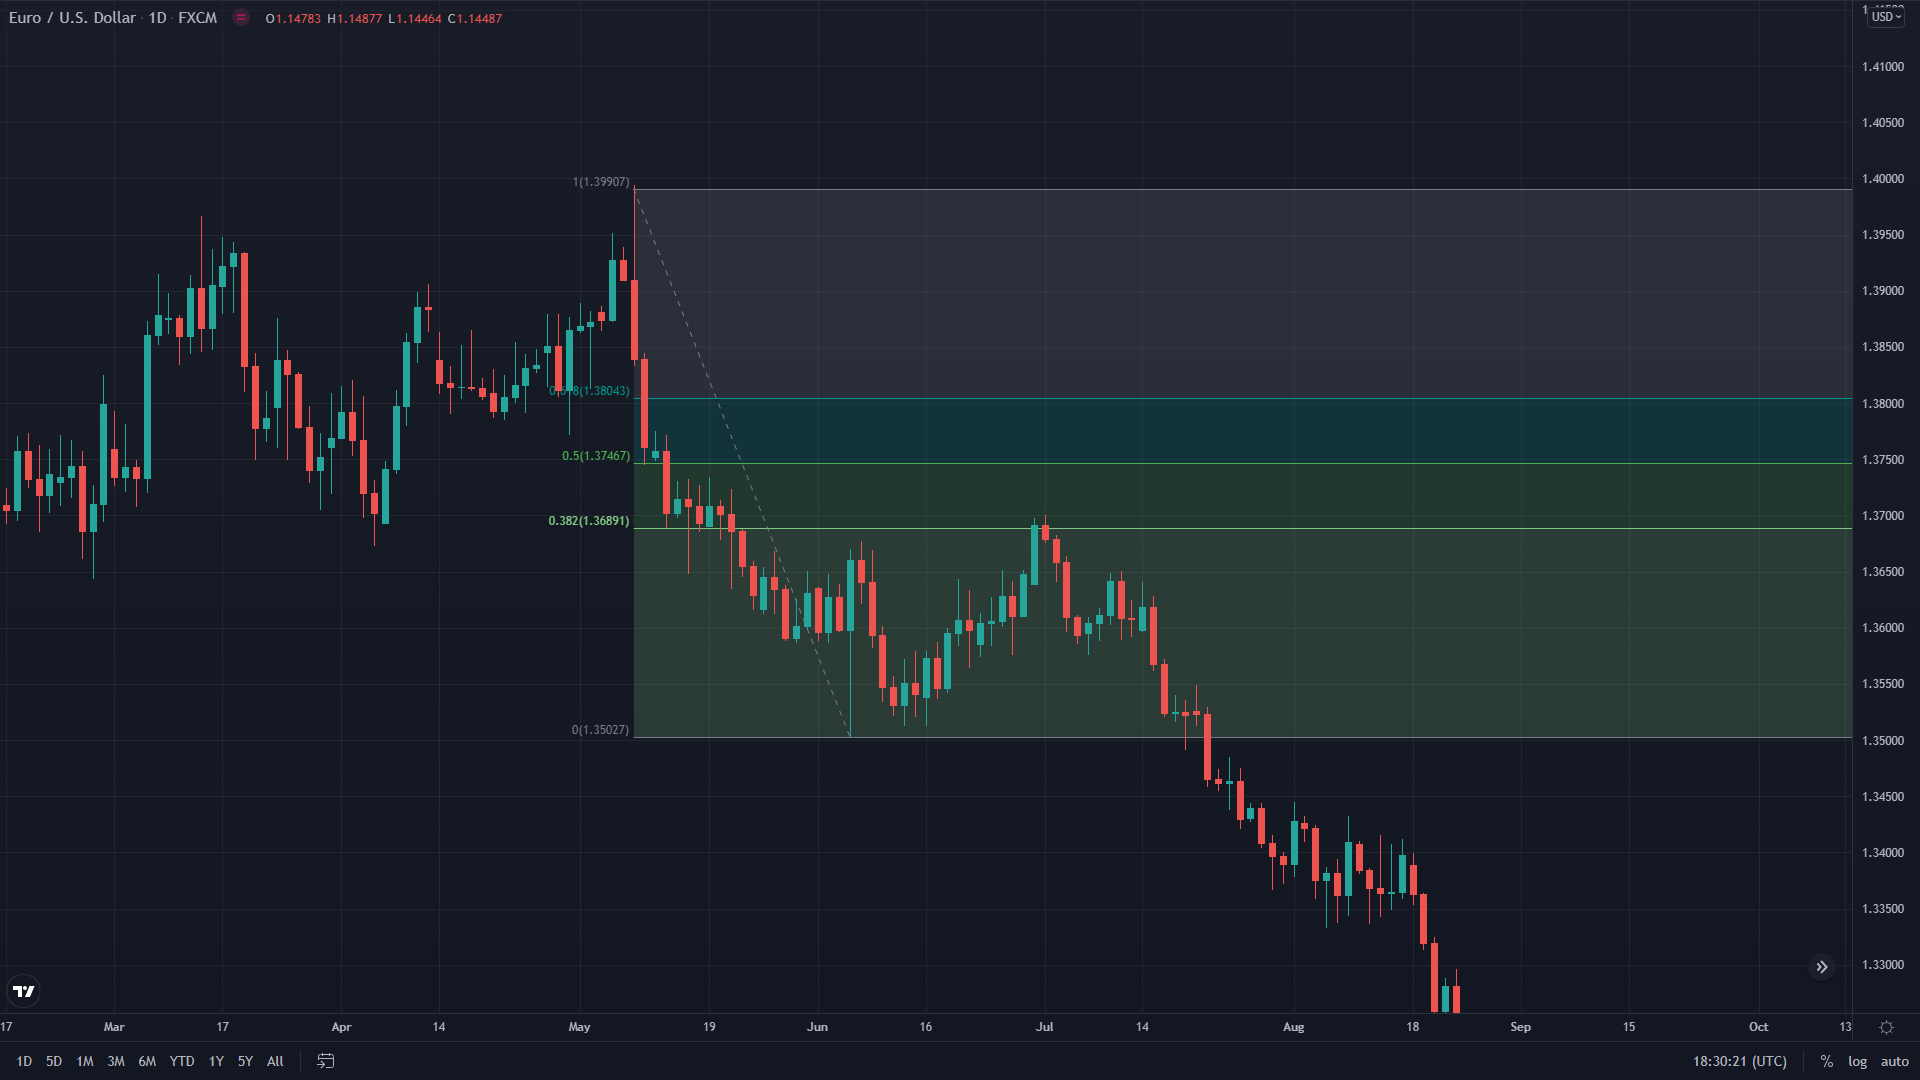
On the following EUR/USD chart a Fibonacci retracement is drawn in a downtrend. Right after the Fibonacci swing low the pair starts to move higher but the 38.2 percent retracement level acts as a stiff resistance area and the pair once again resumes its downtrend.
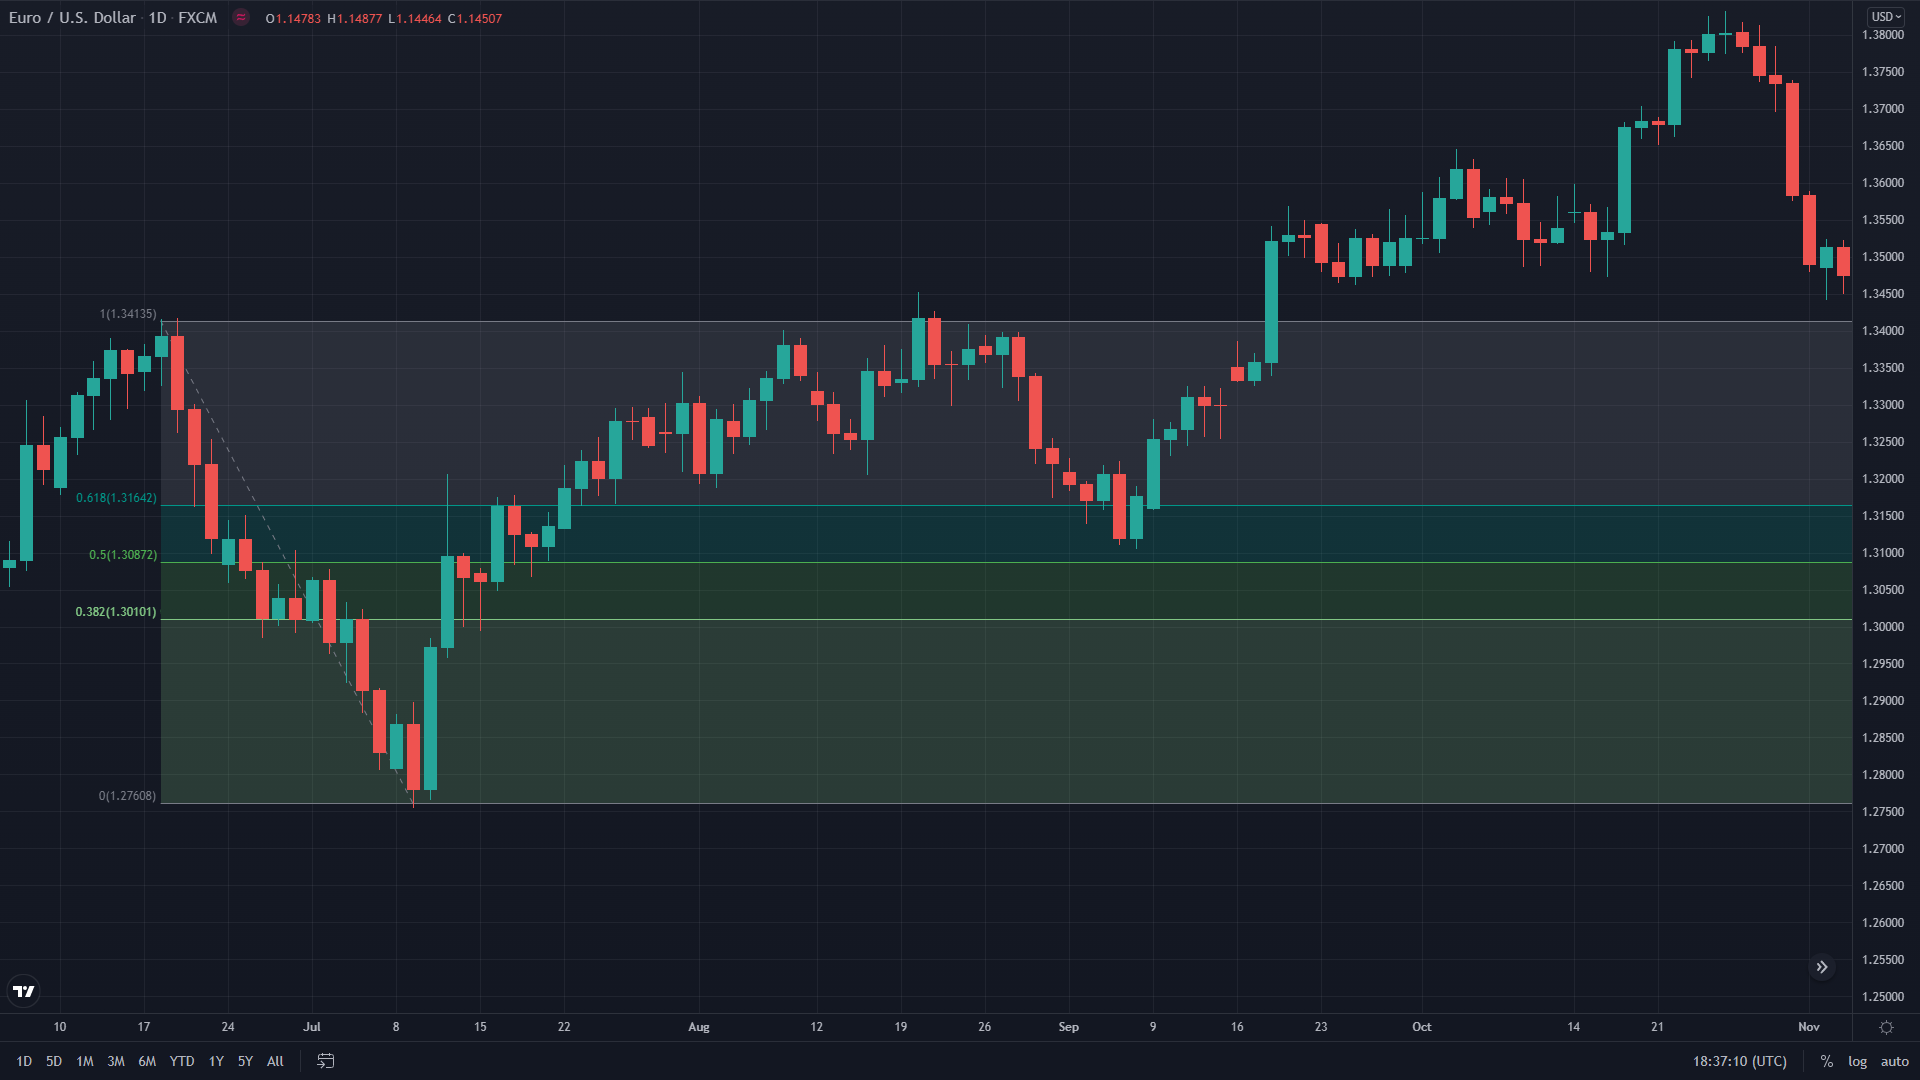
To understand how Fibonacci retracement can indicate a trend reversal let’s take an example from this EUR/USD chart. The pair was trending lower and a Fibonacci retracement is drawn by connecting the swing high to the swing low. The pair starts to recover from the swing low and while recovering it breaches above the 38.2 percent and 50 percent retracement levels. Then after a couple of session the pair also breaches above the 61.8 percent retracement level and continues moving further higher.
A breach above the 61.8% retracement level indicates that the previously ongoing downtrend is now over and the price is now likely to rise.
These are some of the ways to trade using Fibonacci retracement. Fibonacci retracement is a very useful tool however it requires time and skill to master it.