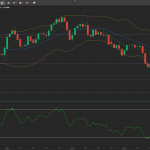
Gold ended the last week on the higher side at $1868. Currently, the yellow metal is trading at $1860 with immediate resistance levels at $1874 and $1888. The intraday support levels are at $1856 and $1843.
On the intraday scale, the price pattern is still bullish with SMA-14 indicating support at $1816 and the SMA-50 support line way below at $1873. The RSI has entered the overbought zone while the MACD is above the middle line. Despite the upwards momentum, a bearish price pattern is building up on the 4-hourly chart and with nearby resistance areas, the gold might enter a correction phase, especially after the RSI overbought indication. Currently, sell entries are ideal around $1865 with a target of $1856 and a stop-loss at $1874.
Since the overall momentum is bullish, a deeper pullback also favors buy entry around $1850 with a take profit at $1861 and a stop-loss at $1843.