Double Top Reversal Pattern
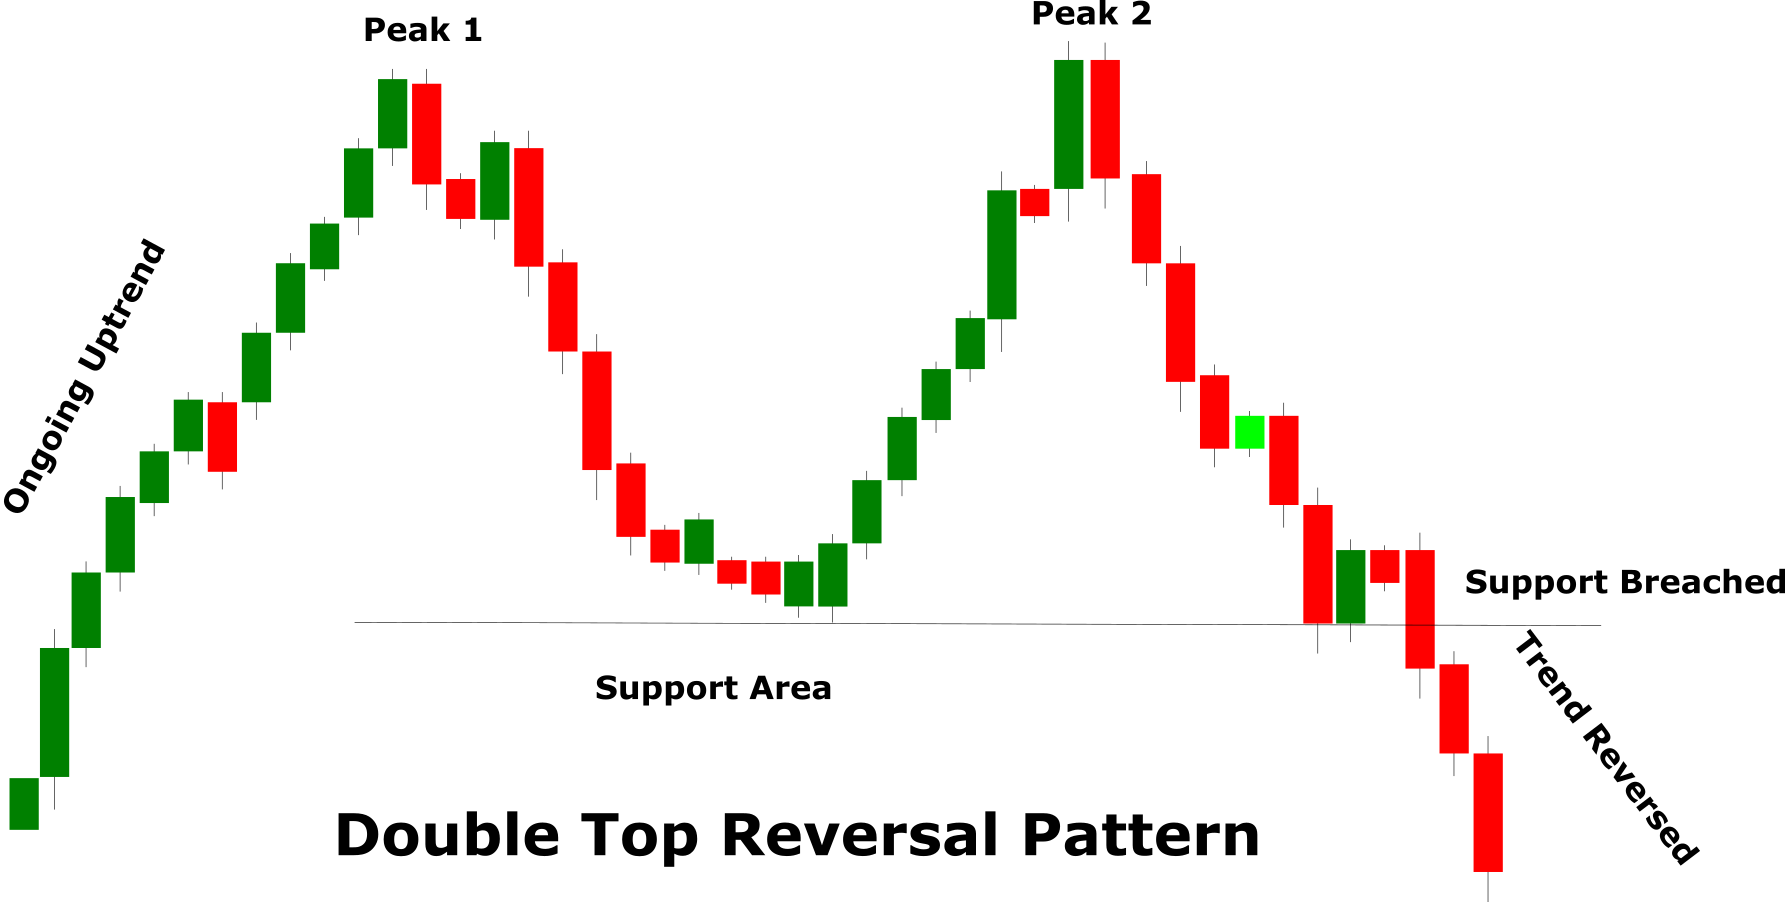
The Double Top Reversal is a bearish reversal pattern that generally forms after an asset price reaches its peak. As the name suggests, the pattern is comprised of two nearly equal peaks with a moderate decline in between. The pattern is confirmed when the price falls from the second peak and breaks the support level created between the two peaks.
Double Top Pattern Anatomy
The Double Top Pattern indicates a possible change in the uptrend. An uptrend tells us that the bulls are in control and there is a significant demand that is causing the price to rise. However, the prices in the financial markets are bound for some correction for several reasons including profit booking, better supply, etc.
So the first peak in the Double Top Reversal Pattern indicates that the buyers are now exiting from the long (buy) trades which causes the price to drop. Following a moderate decline, the bullish forces again try to take control and take the price higher but fail near the first peak. The two consecutive failed attempts around the same level indicate that the bulls are now exhausted and that is likely to help the bearish forces to take control and cause the uptrend to reverse. The reversal is confirmed when bears manage to take the price below the support level between the two peaks.
The Double top is a reversal pattern and like any reversal pattern, there must be an existing trend to reverse. In the case of the Double Top Reversal pattern, a significant uptrend lasting from a few weeks to months should be in place.
The first peak indicates the highest point of the ongoing uptrend. The first peak is fairly normal and at that point, the trend is considered intact.
The decline after the first peak is generally 10 to 20%. The lows sometimes can extend but the overall closing of the market remains within the range before the start of the second peak.
The second peak usually remains contained within the first peak. However, a second peak within the 3% of the first peak is considered adequate.
The period between the two peaks can vary from a few weeks to months. The volume between the two peaks generally remains lower.
The decline from the second peak shows an expansion in the volume. The high volume may also cause an opening with the gap. Such an opening indicates weak demand and the prices may fall quickly.
Even after the decline from the second peak, the pattern will not be confirmed until it breaks below the support level between the two peaks. Generally, the support level is breached when there is a high volume.
The pattern is confirmed once the support line between the two peaks is breached. Following the breach the support line act as a resistance area for future price movement. It is a good idea to have the newly established resistance line being tested a couple of times before taking an entry.
Using The Double Top Pattern
The Double Top Reversal pattern is fairly simple, traders should take proper steps to avoid trading deceptive reversal patterns. The peaks in the pattern should be separated by at least a month. If the peaks are too close they could well be normal resistance areas and may not cause the trend to reverse. Traders must also ensure that the decline between the two peaks should be between 10 to 20%. A decline of less than 10% could well be a smaller correction within a larger trend. Traders must also observe the volume during the making of the double top reversal pattern. A contracting volume during the second peak indicates the market is likely to drop. However, if the volume continues to increase, it could be an indication of rising demand, and the uptrend may resume.
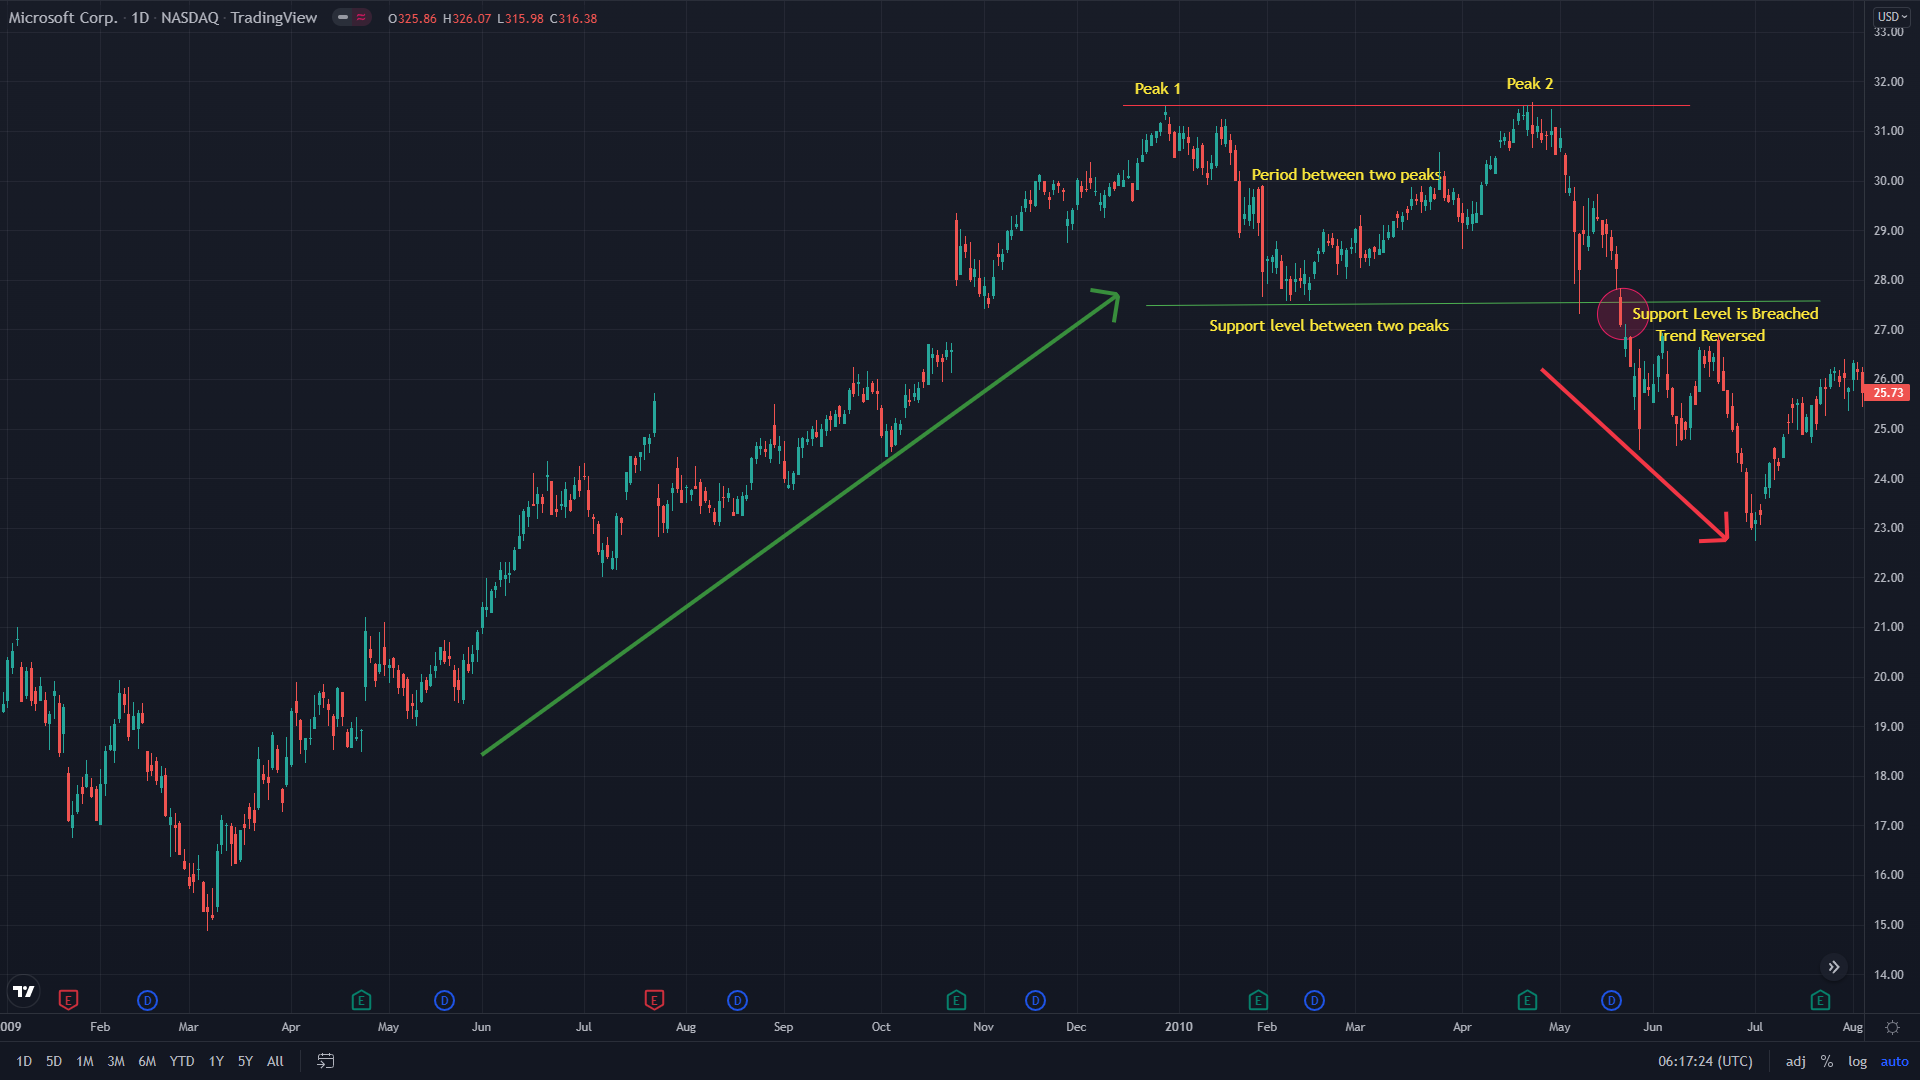
The following Microsoft Chart (MSFT) is a classic example of the Double Top Reversal Pattern. The stock had been rising from $15 until around $32 it showed the first sign of correction and dropped to $27. This created the first peak in the pattern. Following the decline from the first peak, the price remained under pressure for nearly three weeks and created a support level. After a significant price action near the support line, the bulls once again attempted to take the price higher but failed which led to the creation of the second peak. After the second peak, the price kept dropping and finally breached below the support line between the two peaks. The breakout below the support line confirmed the Double Top Reversal pattern and you can see the price continued to drop in the coming sessions.
Avoid Jumping Into Early Trades
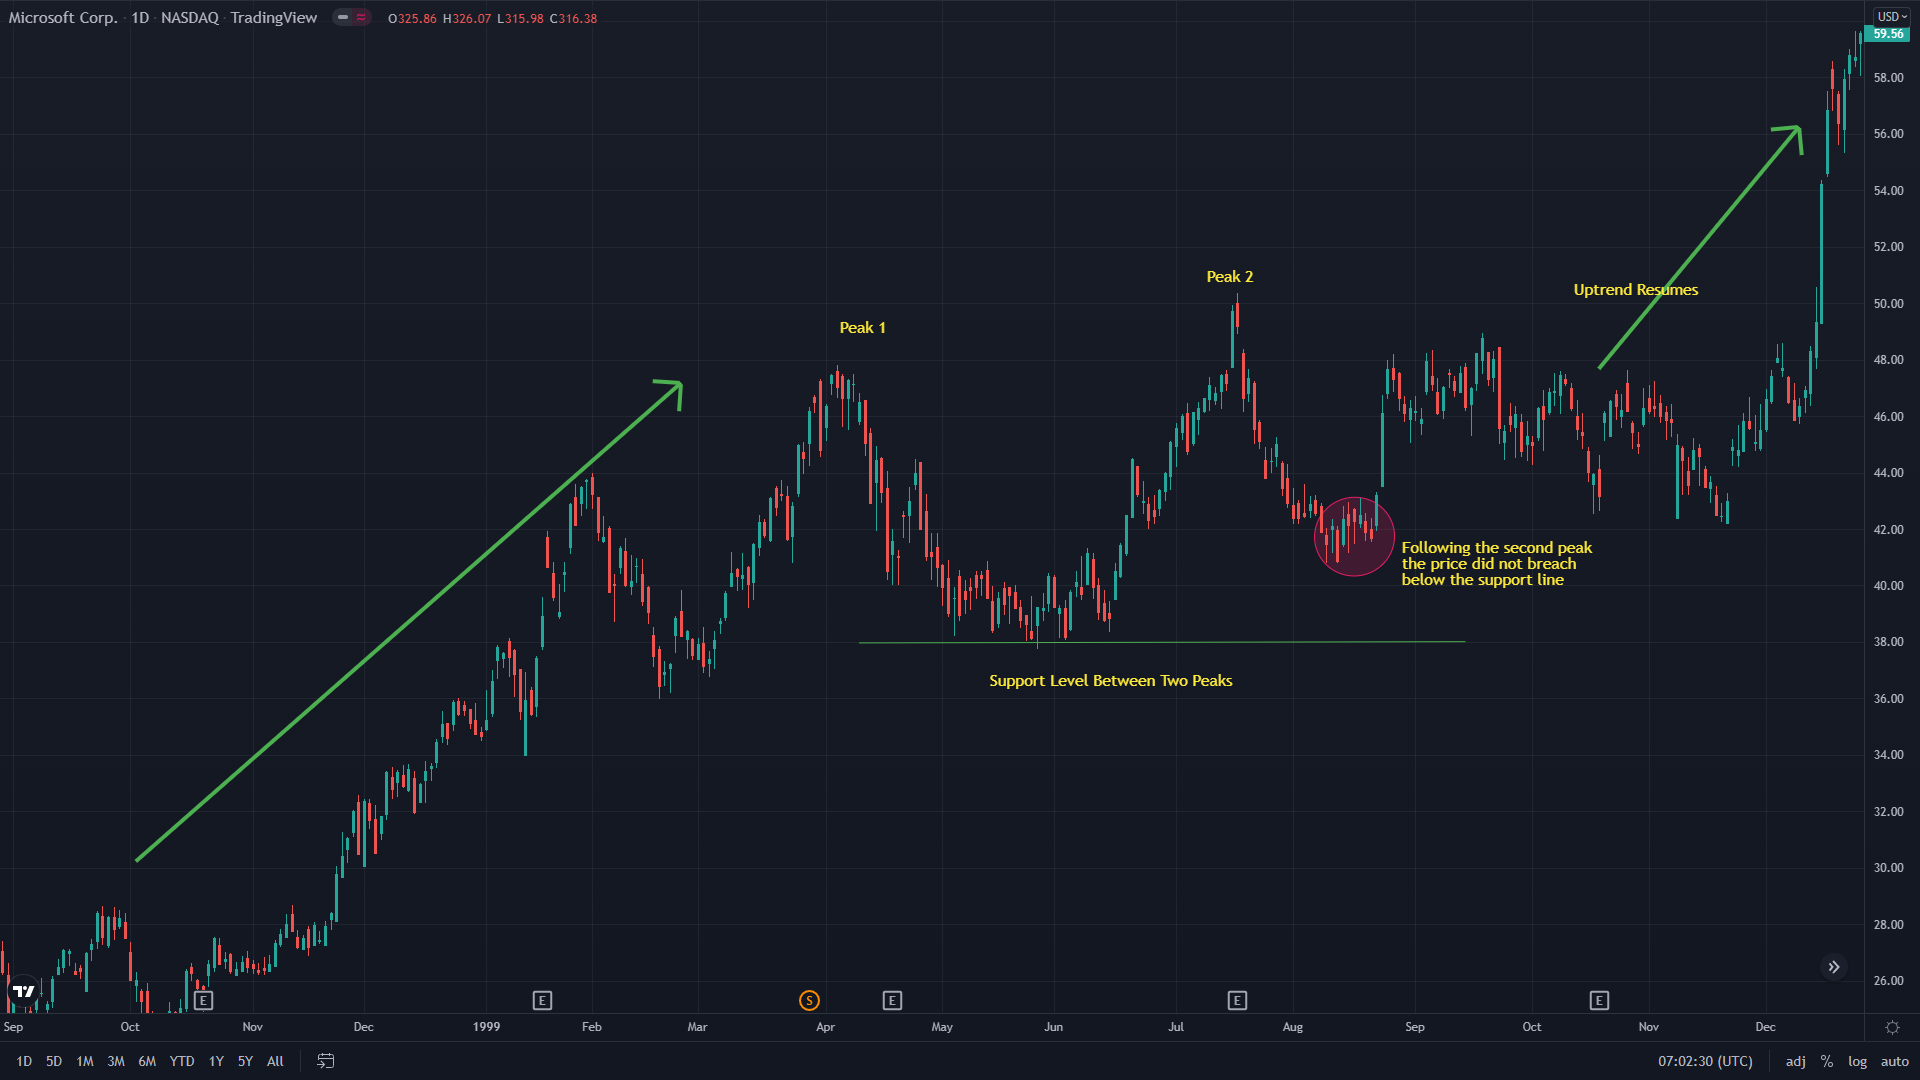
The most important aspect of this pattern is to avoid jumping into an early trade. As a trader, you must wait for the support level to be breached. For a stronger confirmation, you may also wait for at least 3 next sessions to make sure it’s not a fake breakout. Until that happens, the trend may still be intact and you should avoid trading. To understand it further let’s take an example from the following Microsoft (MSFT) chart.
On the chart, a strong uptrend is in place with the first peak near $48. The price dropped from the first peak and created a support area. Soon the price started to rise and a second peak is created. As one may expect, the price dropped from the second peak but it didn’t breach below the support line between the two peaks. The pattern cannot be confirmed until the support line is breached and you can see the uptrend gradually resumed.
Trade Setup Using Double Top Reversal Pattern
The double top reversal pattern presents an opportunity to benefit from a possible change in the uptrend. One of the simplest ways to trade using this pattern is by entering a short (sell) trade when the support level between the two peaks is breached. For additional confirmation of the breakout, you can wait for at least two sessions before entering the trade.
The stop-loss position largely depends on your risk appetite and trading style. You can either keep your stop-loss above the recently breached support line which then acts as a resistance line or you can keep it above both the peaks in the pattern.
The first place to keep the stop-loss is above the recently breached support line which now acts as a resistance line. The second place you can keep the stop-loss is just above both the peaks. Although the stop-loss above the peaks will be far from the entry level it offers and added protection in the event of a sudden spike.
There are multiple ways to determine the take profit. Usually, the take profit is kept above the next support level. You can determine the support level by analyzing the price action and using the trend lines. Another method to determine the take profit is by using a technical indicator like the moving average or RSI. The moving average line act as dynamic support or resistance area. In the case of the Double Top Reversal pattern, if the moving average line is below the current price you can keep your take profit just above that. Likewise, the RSI can also help to determine the exit level. As a general rule of thumb, if the RSI is below the neutral zone (below 50), you can continue holding your position and close the trade just before the RSI enters the oversold zone (30).