

Forex line trading typically refers to a type of technical analysis used in the Forex, stocks, and cryptocurrencies trading. Technical analysis involves using various tools and indicators, and one of these tools is the concept of lines. The idea primarily refers to visual lines drawn on a price chart to analyze the market. These lines are important tools in technical analysis. They help traders visually analyze the price movements based on historical price changes.
There are several types of lines in technical analysis. Let’s start with the trendlines.
Trendlines
As the name suggests, trendlines form the basis of Forex Line Trading. One of the best uses of trendlines is to identify the direction of the prevailing trend. When a currency pair’s price approaches a trendline, it typically indicates an entry or exit point. For example, in an uptrend, traders may consider buying when the price touches an upward-sloping trendline.
Let’s see how one can use trendlines in technical analysis.
Support and Resistance
Traders draw trendlines to establish support and resistance levels. Support lines are drawn horizontally on a chart to establish price levels where a currency pair has historically found buying interest and bounced higher. Resistance lines represent price levels where selling interest has traditionally emerged.
Identify Trends
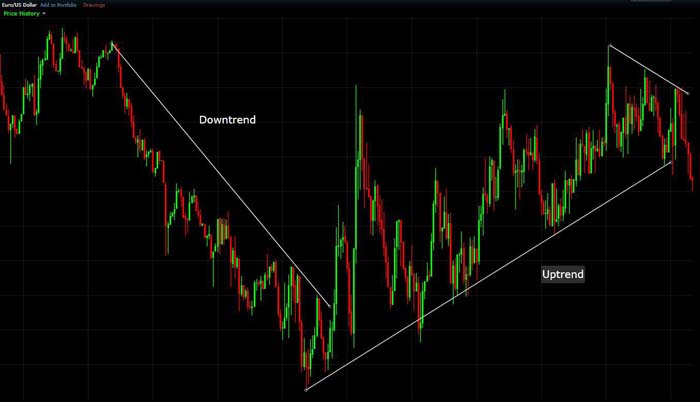
The primary purpose of trendlines is to help traders identify the direction of a trend in a currency pair’s price movement. When an upward-sloping trendline is drawn along the lows of price candles, it indicates an uptrend. Conversely, a downward-sloping trendline drawn along the highs indicates a downtrend. Recognizing these trends is crucial to stay afloat in trading.
Entry and Exit Points
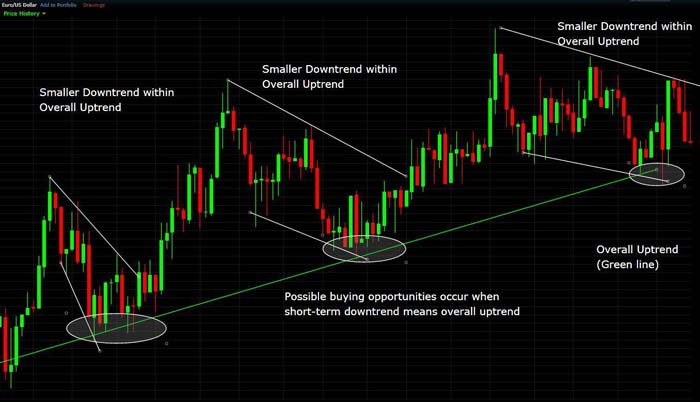
In Forex or any other financial markets, trendlines are an ideal way to find potential entry and exit points for trades. In an uptrend, traders generally buy when the price approaches the trendline. The reason behind buying near the trendline is that the price typically bounces off a trendline and continues moving upwards. Conversely, traders typically sell near the trendline in a downtrend as they anticipate a potential downward movement.
Trend Confirmation
When the price movement consistently validates a trendline, it confirms the prevailing trend. Traders often look for multiple touches or bounce off a trendline to have more confidence in the trend’s strength.
Trend Reversal Signals
Trendlines can also provide early signals of potential trend reversals. If a well-established trendline breaks, it may indicate a possible shift in the trend. For example, if an uptrend’s trendline breaks to the downside, it suggests a change to a downtrend.
Stop-Loss Placement
Traders often use trendlines to place stop-loss orders to manage risk. For example, a trader may place a stop-loss just below the trendline in an uptrend.
Price Channels
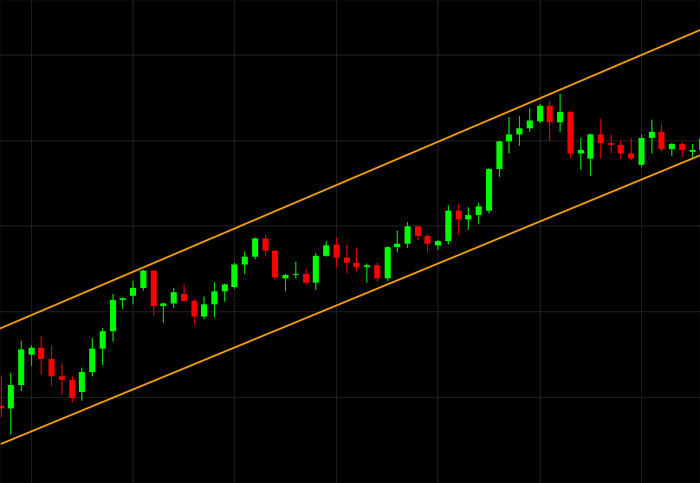
Trendlines are also used to draw price channels. They are created by drawing parallel lines above and below the price, and they represent potential boundaries within which the price moves. Price channels can help traders identify potential breakout or breakdown points.
Price Targets
Trendlines are also useful for estimating potential price targets. In an uptrend, traders tend to extrapolate the angle and slope of the trendline to project where the price might go in the future.
Fibonacci Retracement
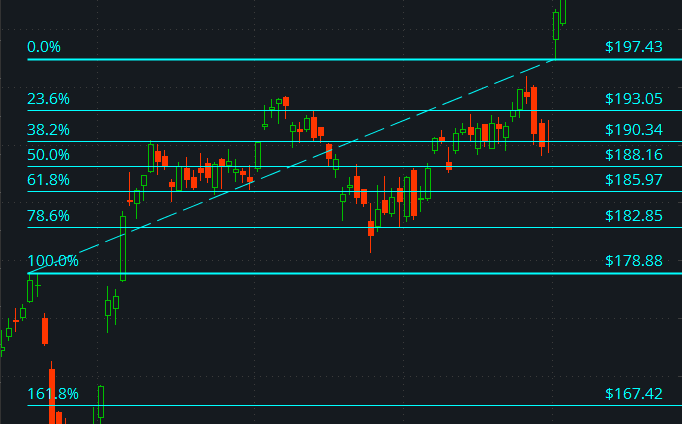
Fibonacci retracement is another useful tool to identify potential support and resistance levels. It helps traders to determine where prices might reverse or consolidate within a trend.
Suppose you have identified an uptrend in a currency pair and want to use Fibonacci retracement levels to find potential buying opportunities. You can draw a Fibonacci retracement from the lowest point of the trend to the highest point. The retracement levels are usually set at specific Fibonacci ratios like 38.2%, 50%, and 61.8%.
Now, let’s look at some indicators to see how Forex Line Trading works.
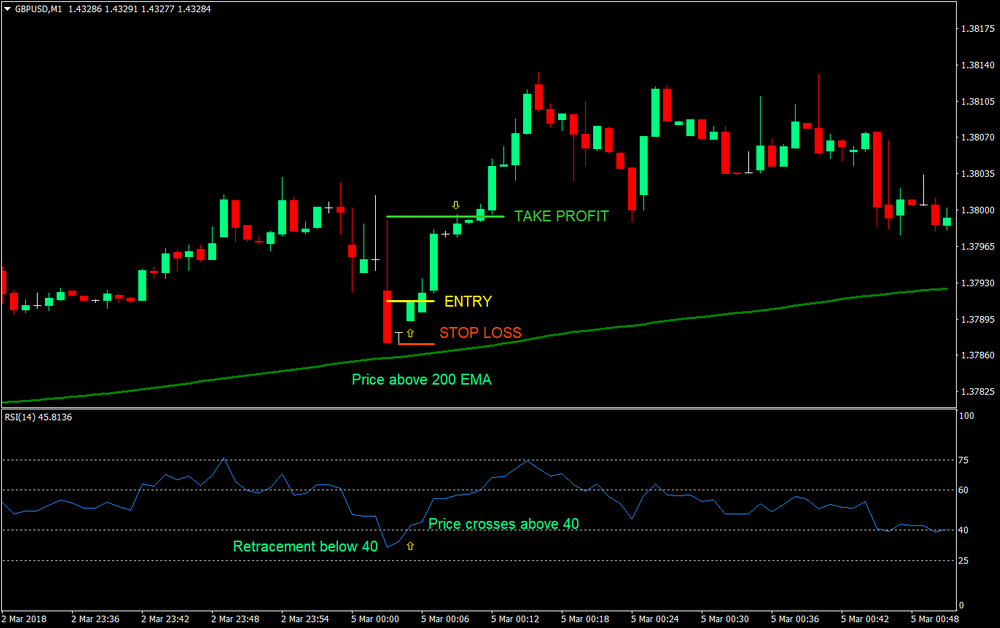
Relative Strength Index (RSI)
RSI is a momentum indicator that plots a line when applied to a chart. The RSI line plays a crucial role in identifying the speed and change of price movements and informing traders about the overbought and oversold zones.
The true potential of RSI is unlocked while using it with other indicators, such as a trendline, Moving Averages, or Chandelier indicator. The indicator is associated with several successful trading strategies such as the Double RSI Strategy and Crossover strategy.
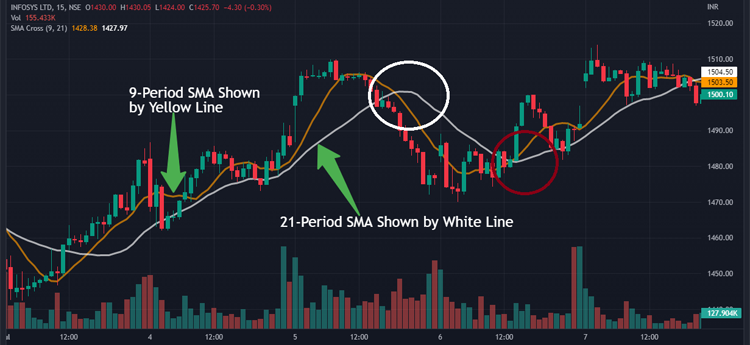
Moving Averages
Moving averages are indicators that smooth out price data over a specific period. They also display a line on the chart that helps identify trends and potential reversals by visually representing the average price over time.
Let’s say you’re looking at a daily currency pair chart, and you decide to add a 50-day simple moving average (SMA) to it. The SMA will calculate the average closing price over the last 50 days and plot a line on the chart. If the current price of the currency pair is above the 50-day line, it suggests an uptrend. If the price is below the SMA line, it indicates a downtrend.
Bollinger Bands
Bollinger Bands consist of a middle line (typically a simple moving average) and two outer bands typically set at certain standard deviations from the middle line. The Bollinger Bands help assess price volatility and potential reversals.
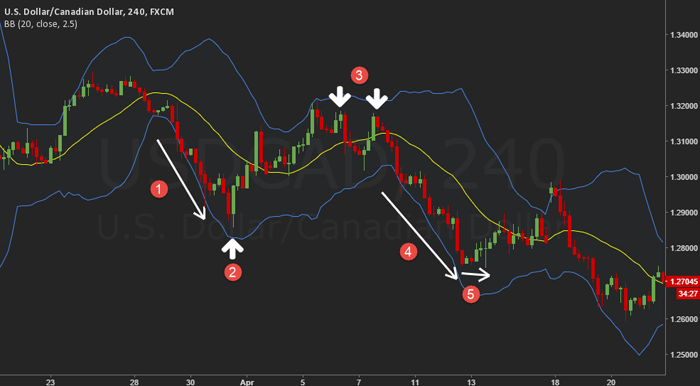
Let’s say you’re analyzing a currency pair’s price on an hourly chart, and you’ve added Bollinger Bands with a 20-period simple moving average (SMA) and two standard deviations. In a volatile market, the bands widen, and in a less volatile market, they narrow.
Final Word
Forex line trading is a valuable trading approach. It provides a visual way to analyze price movements. However, success in Forex trading depends on various factors, including your skills, risk management, market awareness, and adaptability. Like any trading method, Forex line trading also carries risks, and there are no guarantees of profitability. As such, you must invest time in Forex education, practice, and risk management before engaging in live trading.
