Double RSI Strategy
Let me show you a highly profitable Forex and Crypto trading strategy. It’s called the Double RSI Strategy and it has the highest win rate. The strategy requires Chandelier and the Double RSI indicators. I will explain all the points to fix the flaws and increase the odds of winning.
You can use this strategy in any timeframe and make highly profitable trades. I recently used this strategy with trading Ethereum and my success rate was well above 90% Let’s first start with the Chandelier Indicator.
The Chandelier Indicator
For this Double RSI crossover strategy, we will use the Tradingview charts. First, you will change the candlesticks to Heikin and then add the Chandelier Indicator. Many people use the Chandelier indicator without changing the settings which produces false signals. We will change the settings of this indicator to better filter out the false signals.
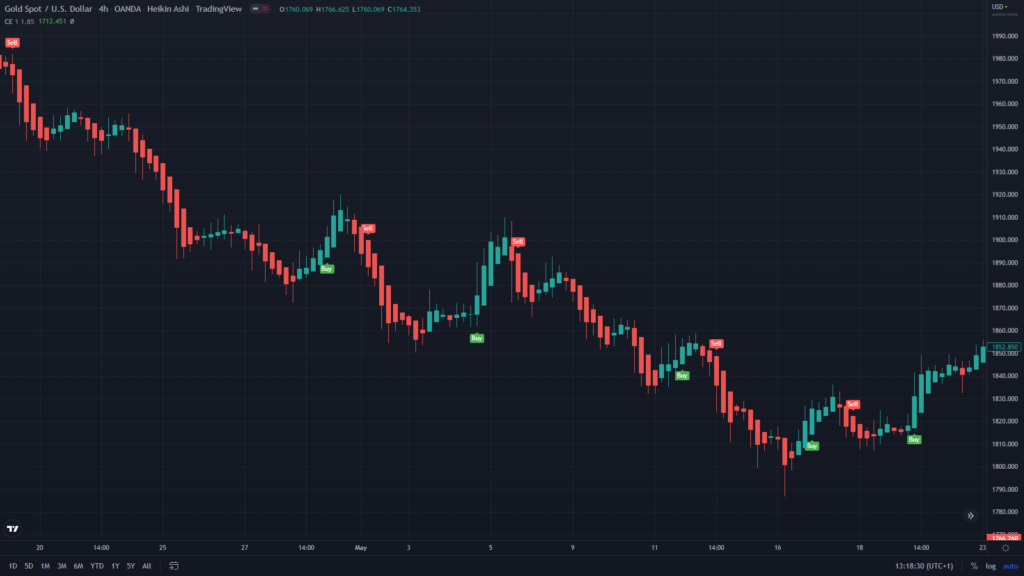
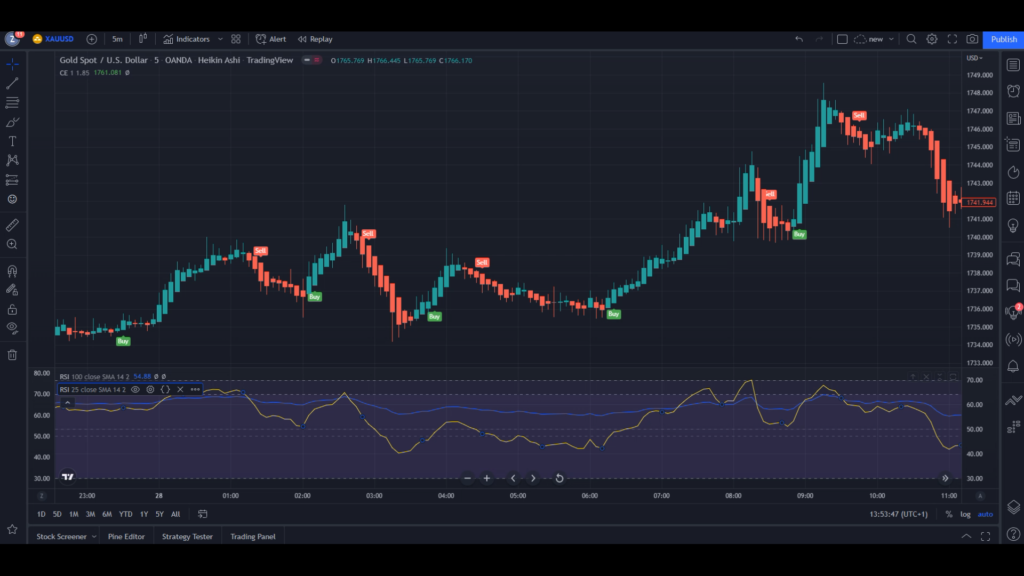
On the following Gold chart, the timeframe is set to 4 hours, and the indicator is applied with the default setting. You can see we have multiple buys and sell signals from the Chandelier indicator. However, most signals are fake, and that’s because the chart timeframe is set to 4 hours, and the indicator is applied with default settings.
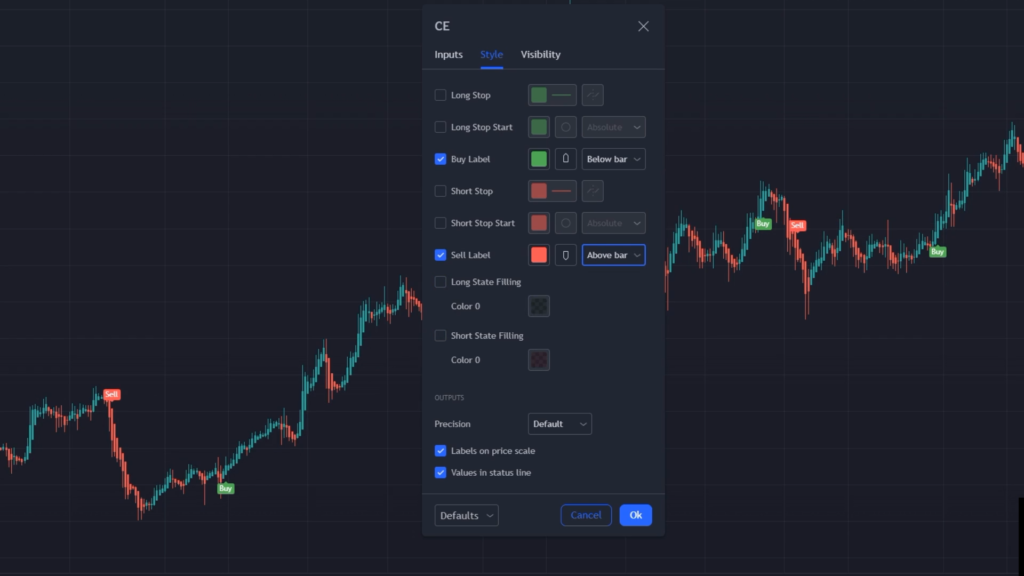
We can remove the false signals by making a few changes to the Chandelier indicator. To change the indicator settings, click on the settings window and uncheck or disable all options except “Buy Lable” and Sell Label”. Then these labels appear below and above the bar.
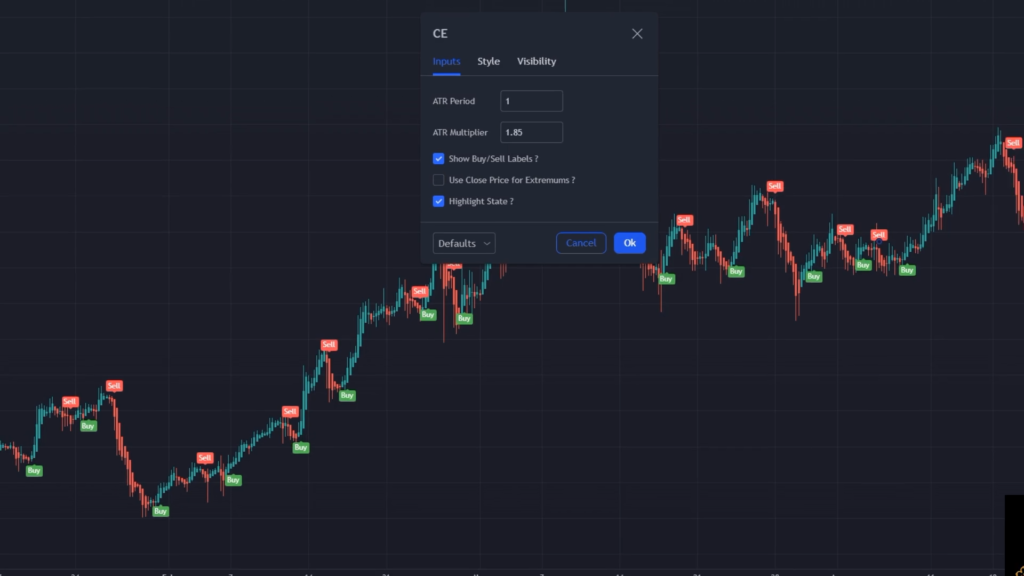
Now from the input section of the indicator, change the ATR period value to 1 and the ATR Multiplier to 1.85, as shown in the following chart.
Remember! In this strategy, we always follow the trend. So, you don’t trade if you get a sell signal in an uptrend. Likewise, you won’t trade if you get a buy signal in a downtrend. In short, we go against the prevailing trend.
We will also use a second indicator which is Double RSI indicator. It is required to confirm the signal. Based on the strategy, both the indicators should produce the same signal to place a trade.
For instance, if you have a buy or a sell signal from the Chandelier Indicator, but the Double RSI does not confirm the signal, you will not take that trade. This way, we will eliminate the false trade signal and make our strategy almost 100% successful.
Double RSI Indicator
So to apply the indicator, go to the indicator section again and add 2 RSI indicators to the chart. The RSI period of both will be 25 and 100 respectively. You can also change the color for the 25-period RSI to yellow and the 100-period RSI to blue. I change these colors for better visual representation, and you can set the colors of your choice. However, make sure the RSI periods are set to 25 and 100.
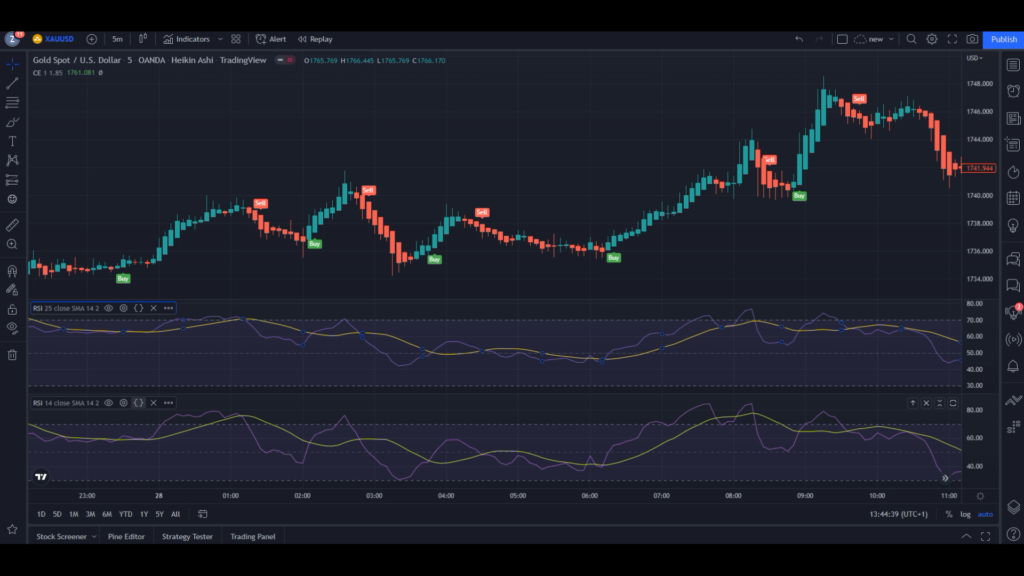
Now, we will put these two RSI indicators together. To do that, click on the three dots, and from the move to option, select the axis pane below. Now, again connect the three dots and change the scale by choosing the pi to scale Z. Our Double RSI indicator is ready, and we can eliminate the false signals.
We will look for a crossover of the two RSI lines to get confirmation from the Double RSI indicator.
A buy signal will be confirmed when the short-period RSI, or the yellow RSI line, crosses the 100-period RSI from bottom to top.
Likewise, a sell signal will be confirmed when the short-period RSI, or the yellow line, crosses the 100-period RSI from top to bottom.
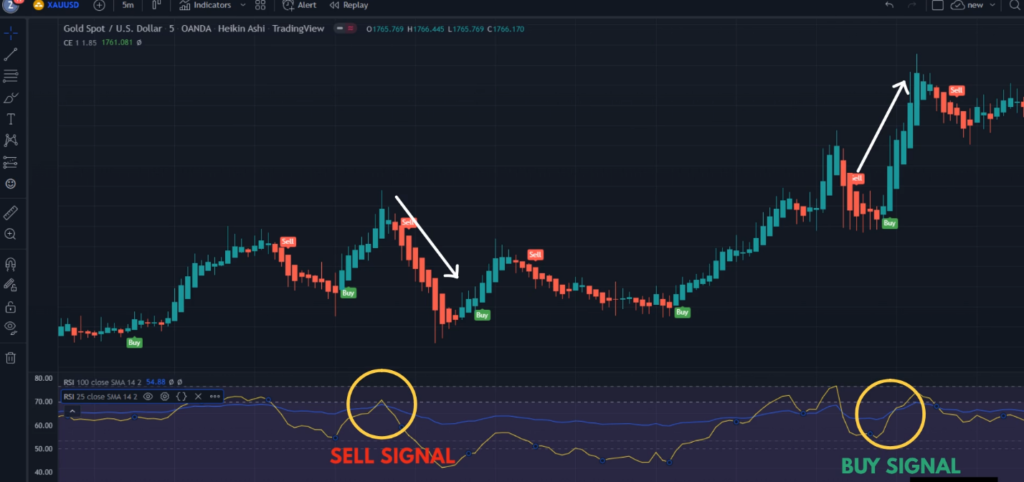
Remember! If we do not get a second confirmation from the double RSI, the Chandelier Indicator signal will not be confirmed, and we will not take the trade.
Filtering Out Fake Signals
Let me show you how the Double RSI filters out the false signals and makes our strategy nearly 100% successful.
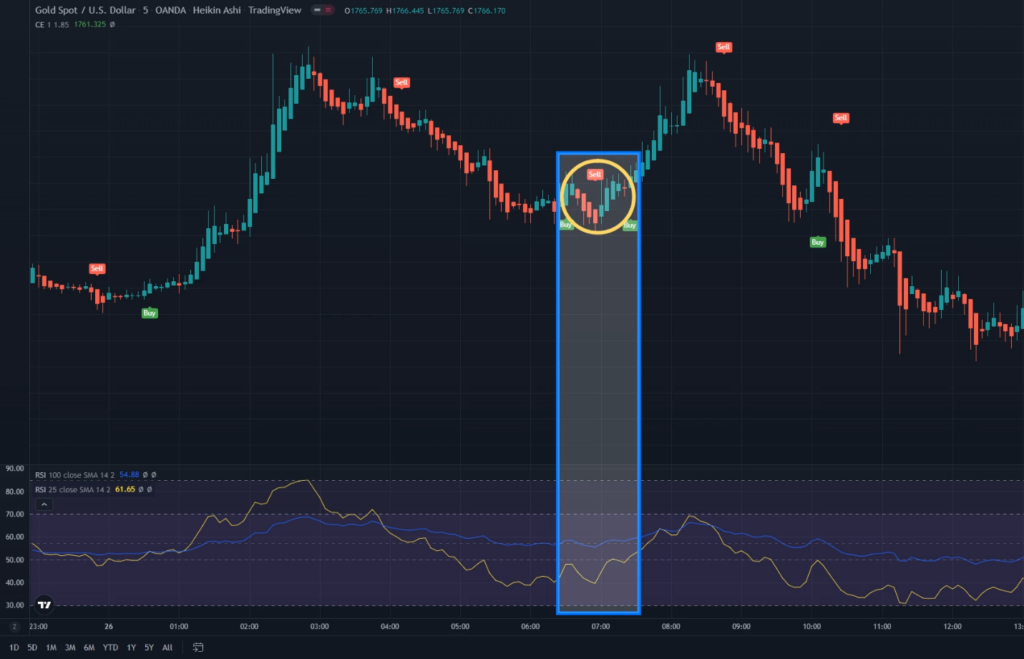
In the following chart, we have a sell signal. Now, we need a second confirmation from the double RSI indicator, and for that, the short period or the yellow RSI line must cross the blue RSI line from top to bottom.
But around the same time when the Chandelier Indicator gave the sell signal, the RSI lines did not have a crossover. The yellow RSI line was already under the blue line. So the second signal was not confirmed, and you can see that the price also started to rise.
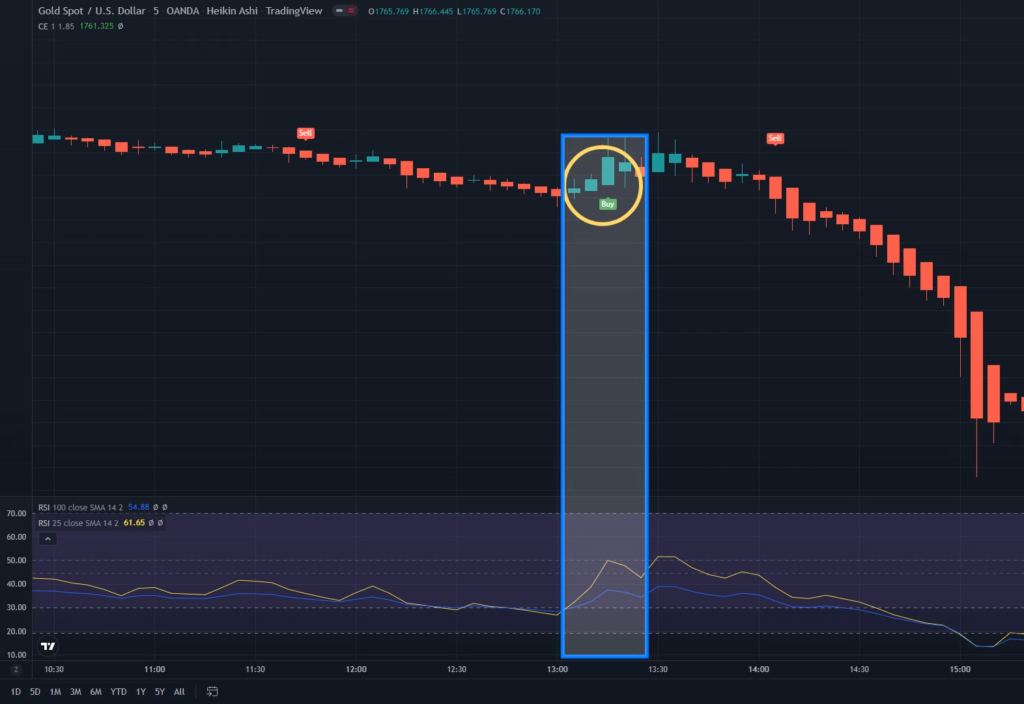
Now let’s also see how the Double RSI indicator helps to filter out the false signal for the buy trades.
The following chart shows a buy signal from the Chandelier Indicator. Now we need a second confirmation from the Double RSI indicator, and for that, the short period, or the yellow RSI line, must cross the blue RSI line from the bottom. However, when the Chandelier indicator gave the buy signal around the same time, the two RSI lines did not crossover. Therefore, the double RSI indicator alerted us about a false trade signal, and the price significantly dropped.
This Double RSI Crossover Strategy is truly unique. By changing the indicator settings and introducing the Double RSI indicator, we have increased the winning chances to almost 100%.
The strategy is equally ideal for new and experienced traders. However, for the new traders. You can apply this strategy to buy or sell crypto, Forex, or even stocks.