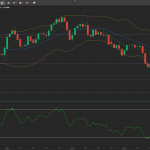
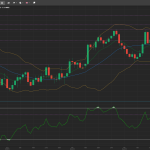
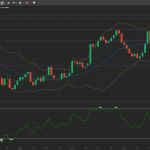
As indicated in yesterday’s analysis, the GBP/USD made some correction and is currently trading at 1.3469. The intraday support levels are at 1.3433 and 1.3400. The near-term resistance areas are at 1.3471 and 1.3490.
On the intraday charts, the upwards momentum appears to be gaining despite bearish indications from the technical indicators. The SMA-14 is indicating resistance at 1.3538 and the SMA-50 resistance line is at 1.3646. The mid-Bollinger band is at 1.3607 while the upper and lower bands are at 1.3908 and 1.3662 respectively. The RSI is at 42 and has an upwards curve. Following the intraday and 4-hourly price patterns, the pair is likely to head towards the SMA-14 resistance line which makes it ideal for buying entries around 1.3450 with a target of 50 to 60 pips and a stop-loss at 1.3415.