Rectangle Pattern
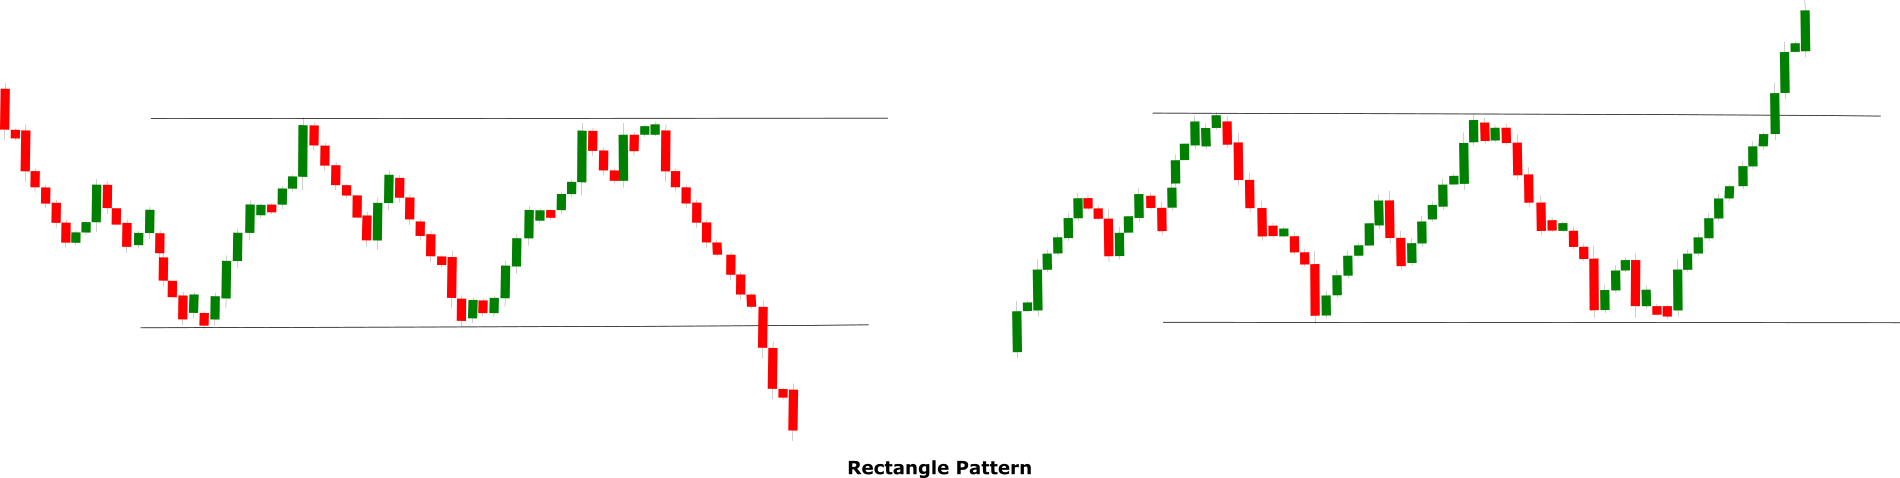
The rectangle pattern is a continuation pattern that indicates the continuation of the prevailing trend. The pattern is comprised of two trend lines that are drawn parallel to each other by connecting a series of highs and lows. Unlike triangle patterns, both the trend lines in the pattern are horizontal and do not converge. The upper trend line acts as a resistance line while the lower trend line act as a support line. A rectangle pattern represents price congestion and it is also referred to as consolidation zone or trading range. The price moves in the narrow trading range and a breakout completes the pattern.
In an up-trending market, a breakout above the resistance line (upper line) indicates the continuation of the uptrend while in a down-trending market a breakout below the support line (lower line) indicates the continuation of the downtrend
Pattern Anatomy
The rectangle is a continuation pattern therefore it requires an established trend to qualify. The duration of the prevailing trend should be from a couple of weeks to a month. The longer the duration of the trend the stronger the pattern will be.
As the pattern progresses the volume should contract and the trading range should get narrow. If this does happen the pattern will not qualify.
The upper trend line should be drawn by connecting two or more equal highs and it should be a horizontal trend line
The lower trend line should be drawn by connecting two or more equal lows and it should also be a horizontal trend line.
The duration of the rectangle pattern should be at least between 2 to 4 weeks. If the rectangle pattern forms too quickly it may indicate a fake-out.
The pattern completes after the breakout. The breakout should be in the direction of the prevailing trend. If the price breaks out in the opposite direction of the ongoing trend the continuation signal will not be valid.
Ideally but not always, the highs and the lows should remain contained within the two horizontal trend lines until the price breaks out.
Following the breakout, the role of the respective trend line reverses meaning the support line acts as a resistance line while the resistance line acts as a support line.
Using The Pattern
The rectangle pattern forms quite frequently in the trending markets and it follows a narrow trading range. Traders must avoid entering the trade in a narrow range and must wait for a breakout. It is also a good practice to wait for a couple of sessions to validate the breakout. Generally, the price comes back towards the breakout point and that is the right time to take entry. To further validate the pattern traders must make sure that breakout is in the direction of the ongoing trend and avoid entering the market if it is in the opposite direction. The volume is the key aspect of the rectangle pattern and it should be observed closely. If the pattern progresses with a high volume it is unlikely to indicate the continuation of the trend.
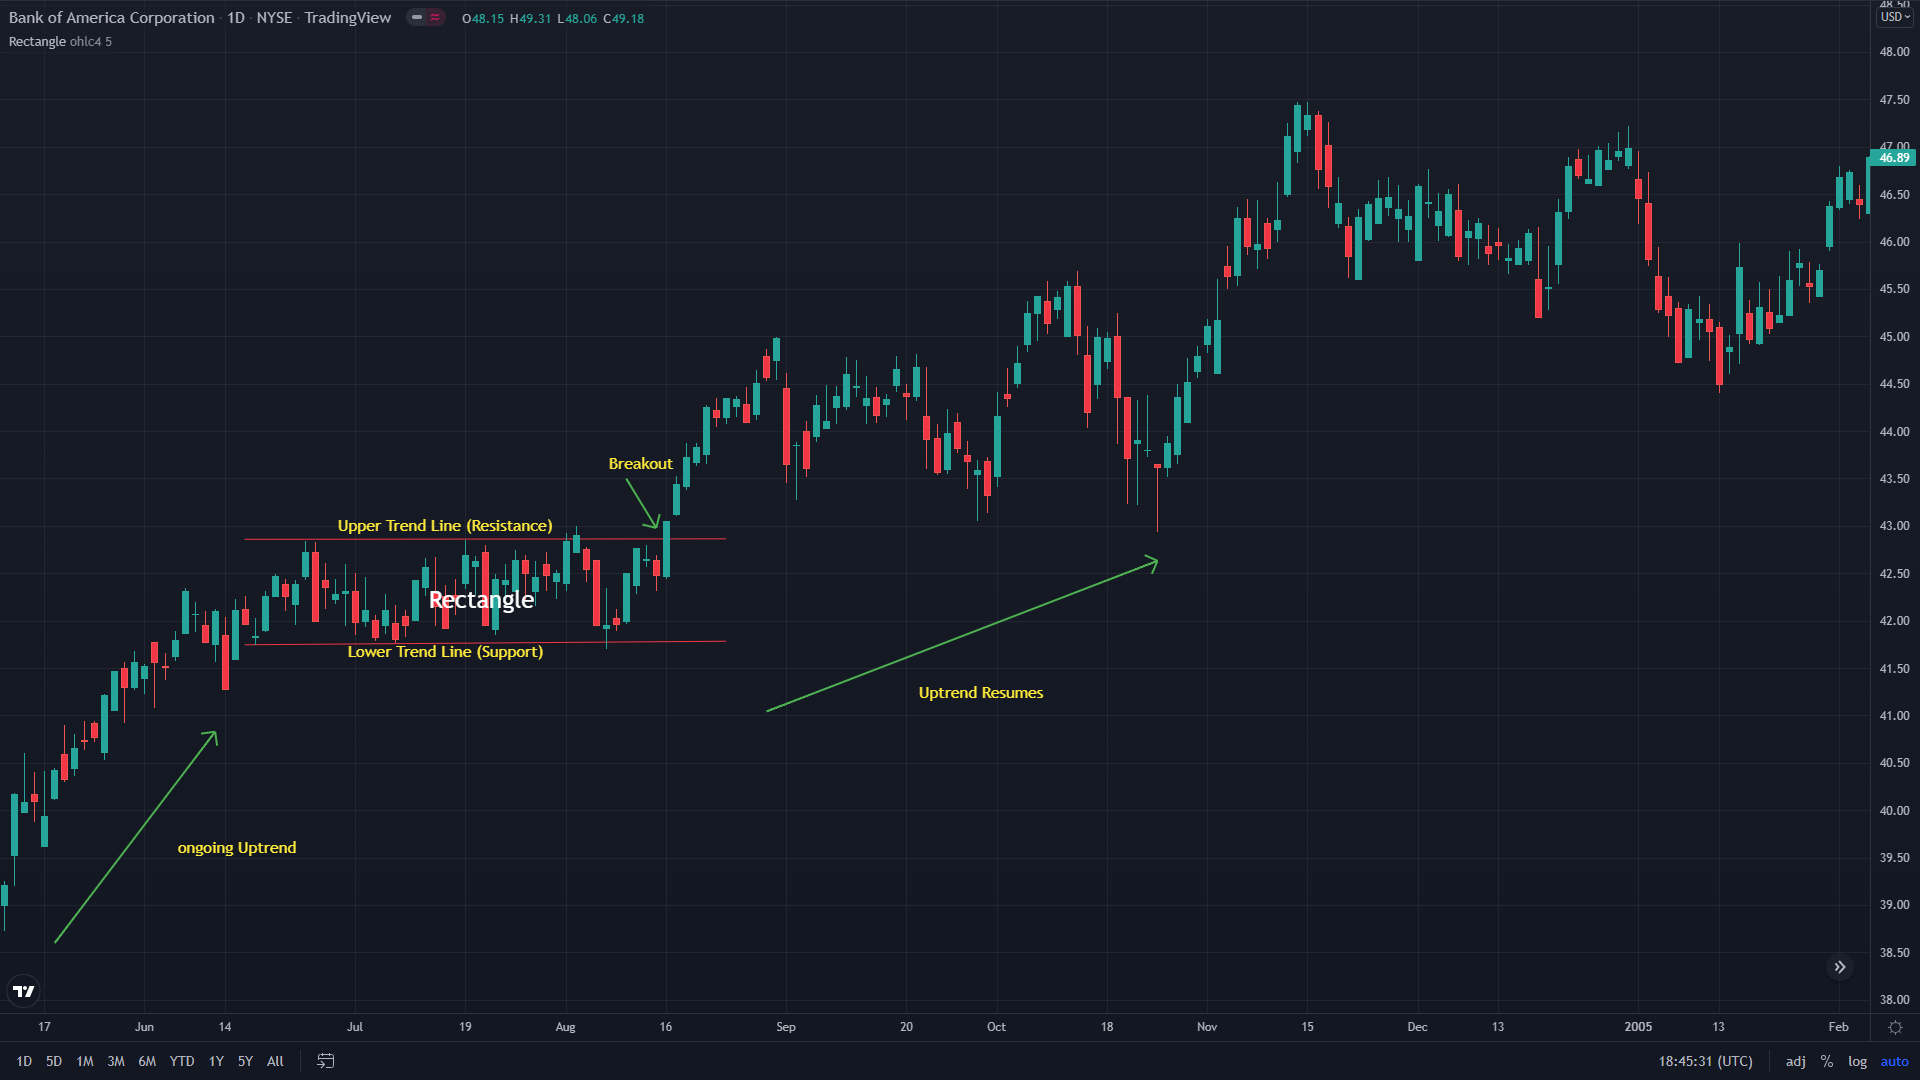
The following chart of Bank of America (BOE) is an ideal example to understand the implication of a rectangle pattern. The share was trending up from $38 until it entered a consolidation phase near $42. The price consolidated in the narrow trading range for some time and two horizontal lines are drawn by connecting a series of highs and lows. In the narrow range, the upper line acted as a resistance line while the lower line acted as a support line. After consolidating in the narrow channel the price finally breached above the resistance line which completed the pattern and indicate the continuation of the prevailing uptrend. Following the indication, you can see the price resumed the uptrend and gradually moved higher towards $48.
The following chart of Gold highlights the implication of a rectangle pattern in a downtrend. The yellow metal was trending lower from $1750 until around $1550 it entered a consolidation phase. The price is consolidated for some time and two horizontal lines are drawn by connecting a series of highs and lows. Following a moderate consolidation period, the price finally breached below the support line which completed the pattern confirmed the bearish continuation signal. Following the signal, the downtrend resumed and the price further slumped towards $1200.

Trade Setup Using Rectangle Pattern
A rectangle pattern is a common pattern and its trade setup is fairly simple. In the scenario of an uptrend, a long (buy) trade is placed. The entry-level of the trade remains near the breakout point. The price generally comes back to the breakout point a couple of times and it is wise to enter the trade once the breakout is fully established.
The stop-loss in this trade setup remains in the middle of the support and resistance lines. For a safer trader, the stop-loss can also be placed below the support line. However, the placement of the stop-loss largely depends on the trading style and the trader’s risk appetite.
The take profit level in this trade setup is generally determined by measuring the distance between the two trend lines. For example, if you are trading forex and the maximum distance between the support and the resistance line is 60 pips then your take profit will also be 60 pips from the entry point. It is a good practice to also use a technical indicator to determine the exit level.
In the scenario of a downtrend, a short (sell) trade is placed. The entry-level remains near the breakout point while the stop-loss remains either in the middle of the support or above the resistance line for safe trade. The take profit is determined by measuring the distance between the support and the resistance lines or with the help of a technical indicator