Ascending Triangle Pattern
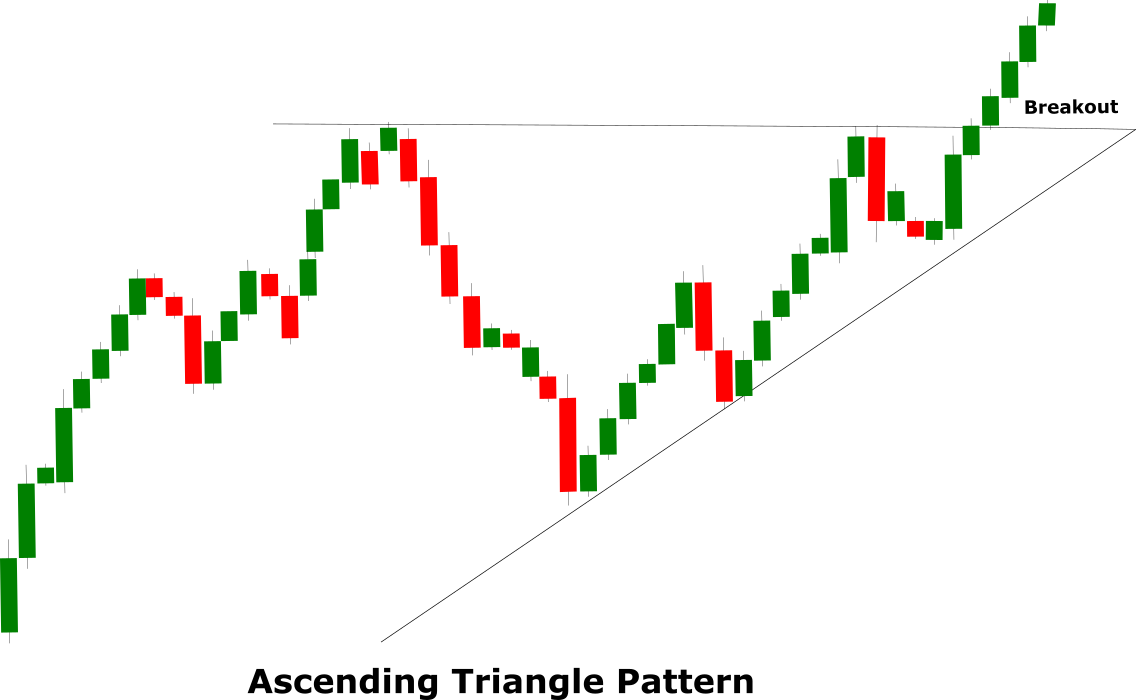
The Ascending Triangle Pattern is a bullish continuation pattern that forms in an up-trending market and indicates the continuation of the uptrend. The pattern is sometimes also referred to as the right-angle triangle pattern. The pattern is comprised of two trend lines that are drawn above each other and they converge towards the end of the pattern. The upper line is usually horizontal and it acts as a resistance line. It is drawn by connecting two or more equal highs. The lower line in the pattern is an upwards sloping line and it acts as a support line. It is drawn by connecting two or more lows. The pattern completes when the price breaks above the upper line (horizontal line) and it signals the continuation of the ongoing uptrend.
Pattern Anatomy
The Ascending Triangle Pattern is a bullish continuation pattern therefore it requires a prior uptrend that is in place from at least a couple of weeks to a month. As a general rule of thumb, the longer the duration of the trend the stronger the pattern is.
An ascending triangle is comprised of two trend lines. The upper trend line should be horizontal and connect at least two equal highs. The pattern completes only when the price breaks above the upper horizontal line.
The lower trend line should slope upwards and connect at least two lows. The second low that connects the trend line should be higher than the previous low. If the lower trend line does not slope upwards the two trend lines will not converge and the pattern will not be completed.
The volume should decline as the pattern progress meaning the trading range should contract. This refers to the silence before the storm.
The duration of the symmetrical triangle pattern should be between a few weeks to a couple of months. If the pattern forms too quickly there will be more chances of a fakeout.
Once the breakout occurs, the role of the upper resistance line (horizontal line) reverses and it acts as a resistance line. Traders should wait for at least a couple of sessions to validate the breakout.
Using The Pattern
An ascending triangle pattern is a bullish continuation pattern and traders should refrain from trading if the pattern forms in a sideways or down-trending market. The volume is an important aspect of this pattern and it declines as the price progresses. However, the volume increases towards the end of the pattern and indicates the breakout. Therefore traders must analyze the volume to correctly identify the pattern and to stay on the right side of the market. Traders should not immediately enter the market right after the breakout and should wait at least a couple of sessions to validate the breakout. It is also wise to analyze the pullbacks and rallies in the ascending triangle pattern and if the highs and lows are continuously expanding then it may not be a valid ascending triangle pattern.
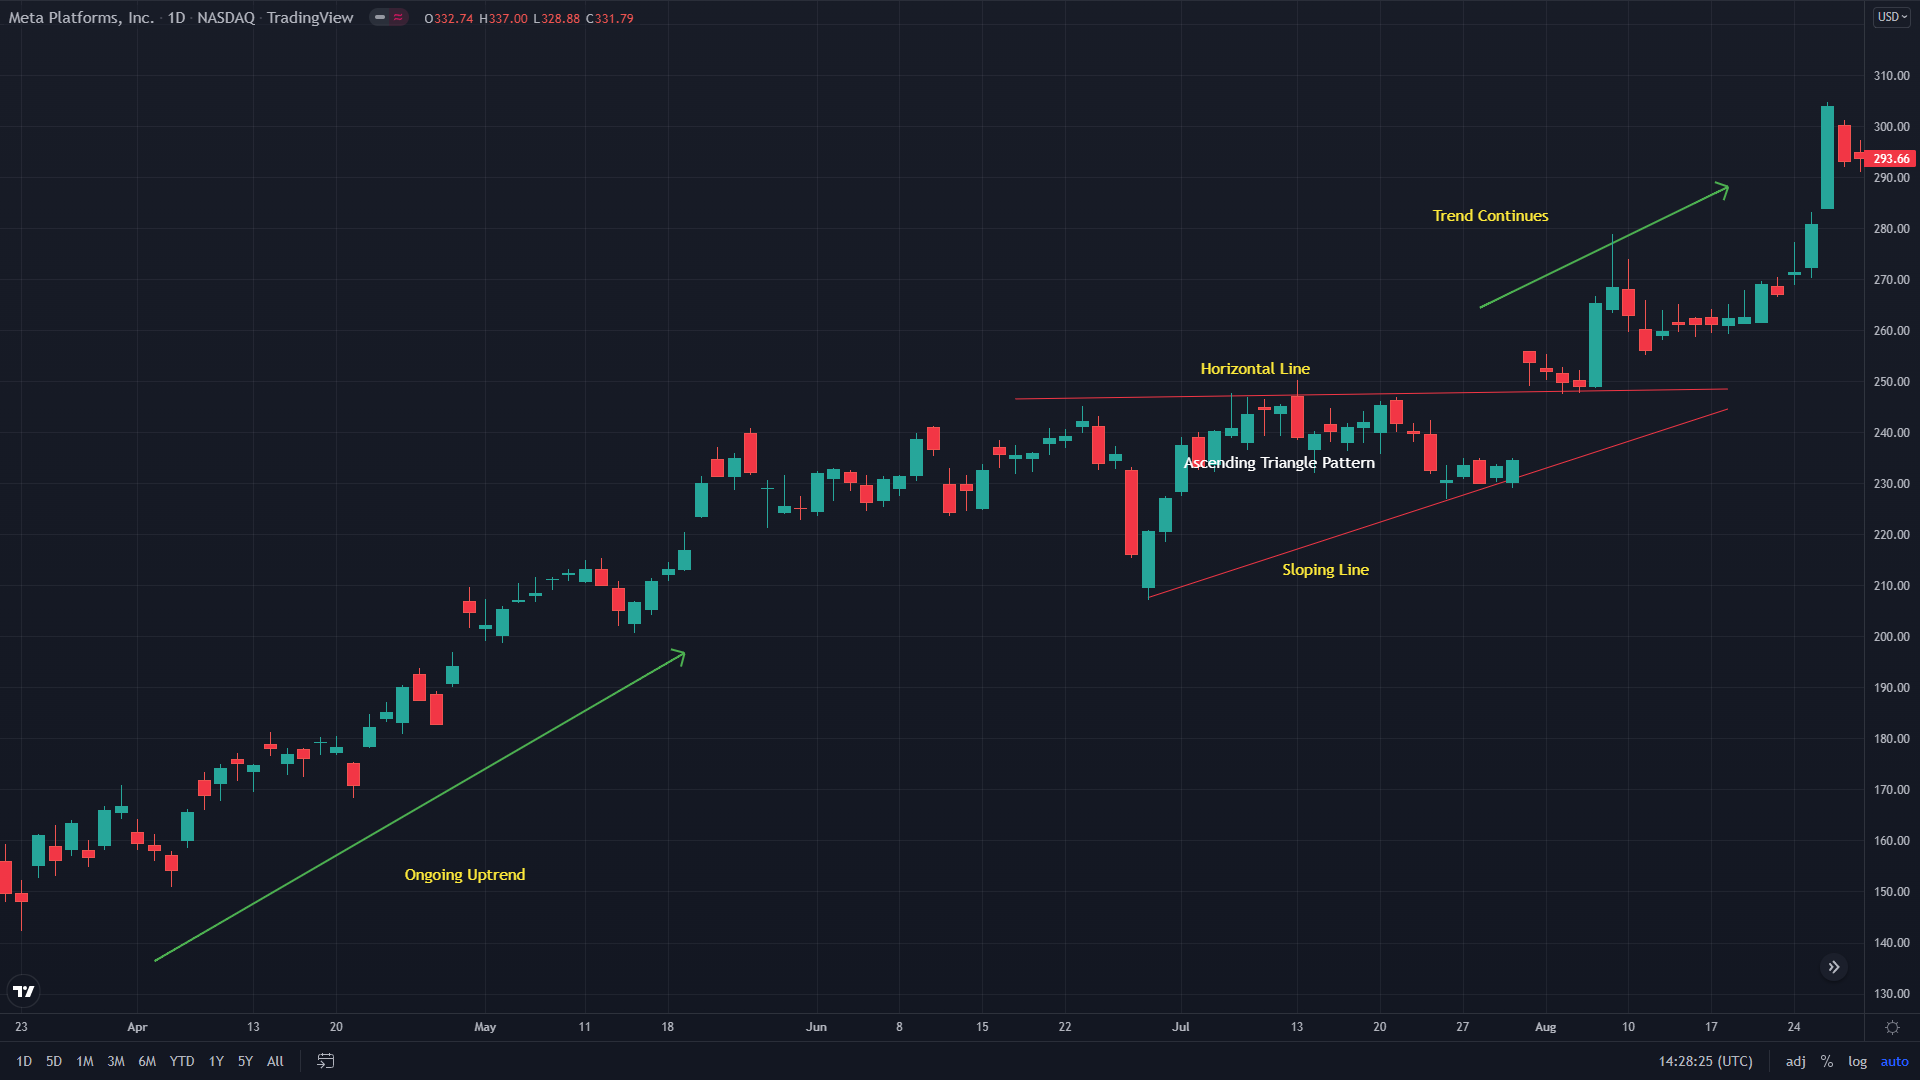
The following chart of Meta Platforms (FB) is an excellent example of an ascending triangle pattern. The stock price had been rising from $130 until around $240 it made some correction towards $210. The upper horizontal line is drawn between by connecting a couple of equal highs while the lower trend line is drawn by connecting the lows. The second low in that is connecting the trend is higher than the previous low. The volume also contracted as the pattern progressed. The share price then finally breached above the horizontal resistance line and completed the pattern and signal the continuation of the ongoing uptrend. Following the signal, the share price resumed the uptrend and moved higher towards $300.
You can also notice the share price gapped higher during the breakout. Usually, when such a breakout takes place it indicates a strong signal and the volume also increases in this scenario. The blue candlestick after the breakout has a large real body which indicates the higher volume and the share managed to rise almost $50 from the breakout.
Trade Setup Using Ascending Triangle Pattern
The Ascending triangle pattern is a bullish continuation pattern therefore long (buy) traders are placed following the completion of the pattern. Using the ascending triangle pattern the entry is taken near the breakout point. Usually, the price comes back to the breakout point and it is always a good practice to wait for a better entry point rather than jumping into the trade immediately after the breakout.
Once the breakout takes place, the upper horizontal line act as a support line. So the short-term traders can place the stop-loss just below that while the long-term traders can place the stop-loss below the lower trend line. The stop-loss below the lower trend line is considered safer compared to the one that is placed near the upper trend line. However, the placement of the stop-loss largely depends on the style of the trading and the risk appetite.
The take profit using the Ascending triangle pattern is generally placed just below the next resistance level. The take profit can also be determined by analyzing the strength of the upwards rally that takes place after the breakout. A momentum indicator like the Bollinger Bands or an oscillator like the RSI comes in handy to determine the exit point. For example, if you use the RSI you can continue holding your position until it reaches the overbought zone.