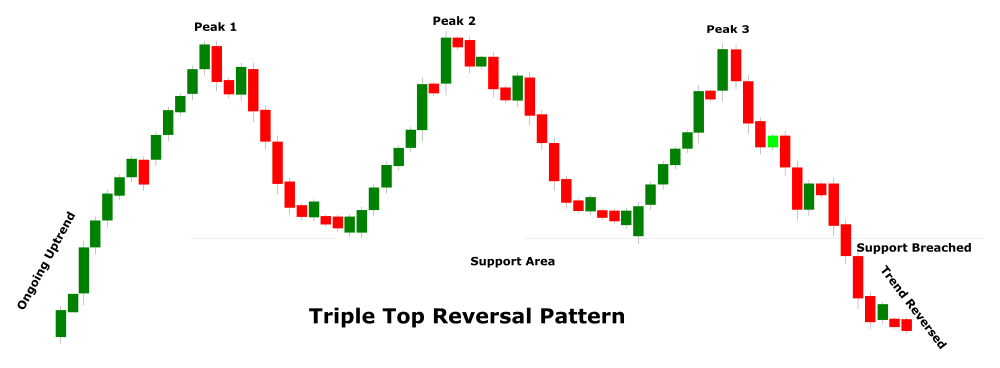
Triple Top Reversal Pattern
The Triple Top Reversal is also a bearish reversal pattern and is considered a stronger pattern compared to the double top reversal pattern. Unlike the double top pattern, the triple top pattern is comprised of three identical peaks with a moderate decline between each peak. The pattern completes and the reversal indication is confirmed when the price breaches below the support area created between the three peaks.
Pattern Anatomy
The price movement on a chart represents the struggle between the bullish and bearish forces. Both the forces attempt to take the price in either direction that creates different formations and patterns. In simple words, the price movement relates to the delicate balance between supply and demand. An oversupplied market results in a lower price while a higher demand causes the price to increase.
The triple top pattern is a bearish reversal pattern meaning it tells the traders about a possible change in the rising prices. The first peak that marks the beginning of the pattern indicates a well-supplied market and it results in a moderate drop. After the first drop, the price remains under pressure for some time until bulls intervene and take the price near the first peak but again fail to move any further higher. The second decline further indicates a well-supplied market. Following the second decline, the price moves near the recently created support areas until bulls make a third attempt to take the price higher that also fails. The three consecutive declines from almost the same area indicate a strong resistance or well-supplied market and it causes the price to drop even below the recently created support area and change the trend permanently.
The triple top is a bearish reversal pattern and like any other bearish reversal pattern, it also requires a strong uptrend that is in place from a few weeks to months.
To have a strong indication from a triple top pattern, the period between the three peaks should be between a few weeks to a couple of months.
The first two peaks in this pattern indicate the two highest points in the ongoing uptrend and do not necessarily mean that trend has changed. These peaks could well be a small correction phase and the ongoing uptrend may resume.
The decline from the third peak does not confirm the signal. The signal is confirmed only when the price breaks below the support level formed between the three peaks. The support level is often breached when the volume is high.
The three peaks should be almost identical. Likewise, the decline between the peaks should also be consistent. However, the lows or the highs in the decline periods can extend but the overall movement should remain within the range.
In an ideal situation, the second and the third peak should be contained within the first peak. If the third peak extends above 5% of the first peak there will be fewer chances of a reversal and the market may resume the ongoing uptrend.
As the triple top pattern forms the volume usually declines. However, it remains higher near the peak and if the volume significantly declines near the third peak it signals low demand, and the price may fall sharply than anticipated.
Once the support line between the three peaks is breached it acts as a resistance area. For a strong confirmation, it is always a good idea to have the newly established resistance line tested in at least three upcoming sessions.
Using The Pattern
The triple top pattern is considered a stronger reversal pattern compared to the double top pattern. However, despite that, you should take extra measures to confirm the signal. You should make sure that peaks in the pattern are not too close. If they are too close it may be a regular correction and not a sign of a trend reversal. You should also pay attention to the decline between the peaks. If the decline is way too small this may not result in a trend reversal. Likewise, volume is also an important aspect and should be observed closely. A contracting volume near the third peak favors the bearish bias. Therefore a high volume near the third peak should be observed closely as it may cause the ongoing uptrend to resume.
The following example of the GBP/USD chart highlights the significance of a triple top reversal pattern. The uptrend started around 1.1970 and continued until the first decline started near 1.2800. The decline formed the first peak in the pattern. Following a drop of over 250 pips from the first peak the bullish momentum once again picked up which is again followed by a decline. The two consecutive declines created a significant support area in between the peaks and caused the price to rise for the third time. However, the pair even failed for the third time to move above the previous two peaks and this time the drop extended below the newly established support line. The breakout below the support line confirmed the Triple Top Bearish pattern and you can the pair gradually moving lower.

Avoid Jumping Into Early Trades
Like any other reversal pattern, you must avoid jumping into an early trade and seek a reversal confirmation before entering a sell trade. In a triple top reversal pattern, the majority of the traders make a mistake by entering a sell trade right after the decline from the third peak. The pattern confirmation comes only when the price breaks below the newly established support line in between the peaks and if that does not happen the uptrend may resume anytime.
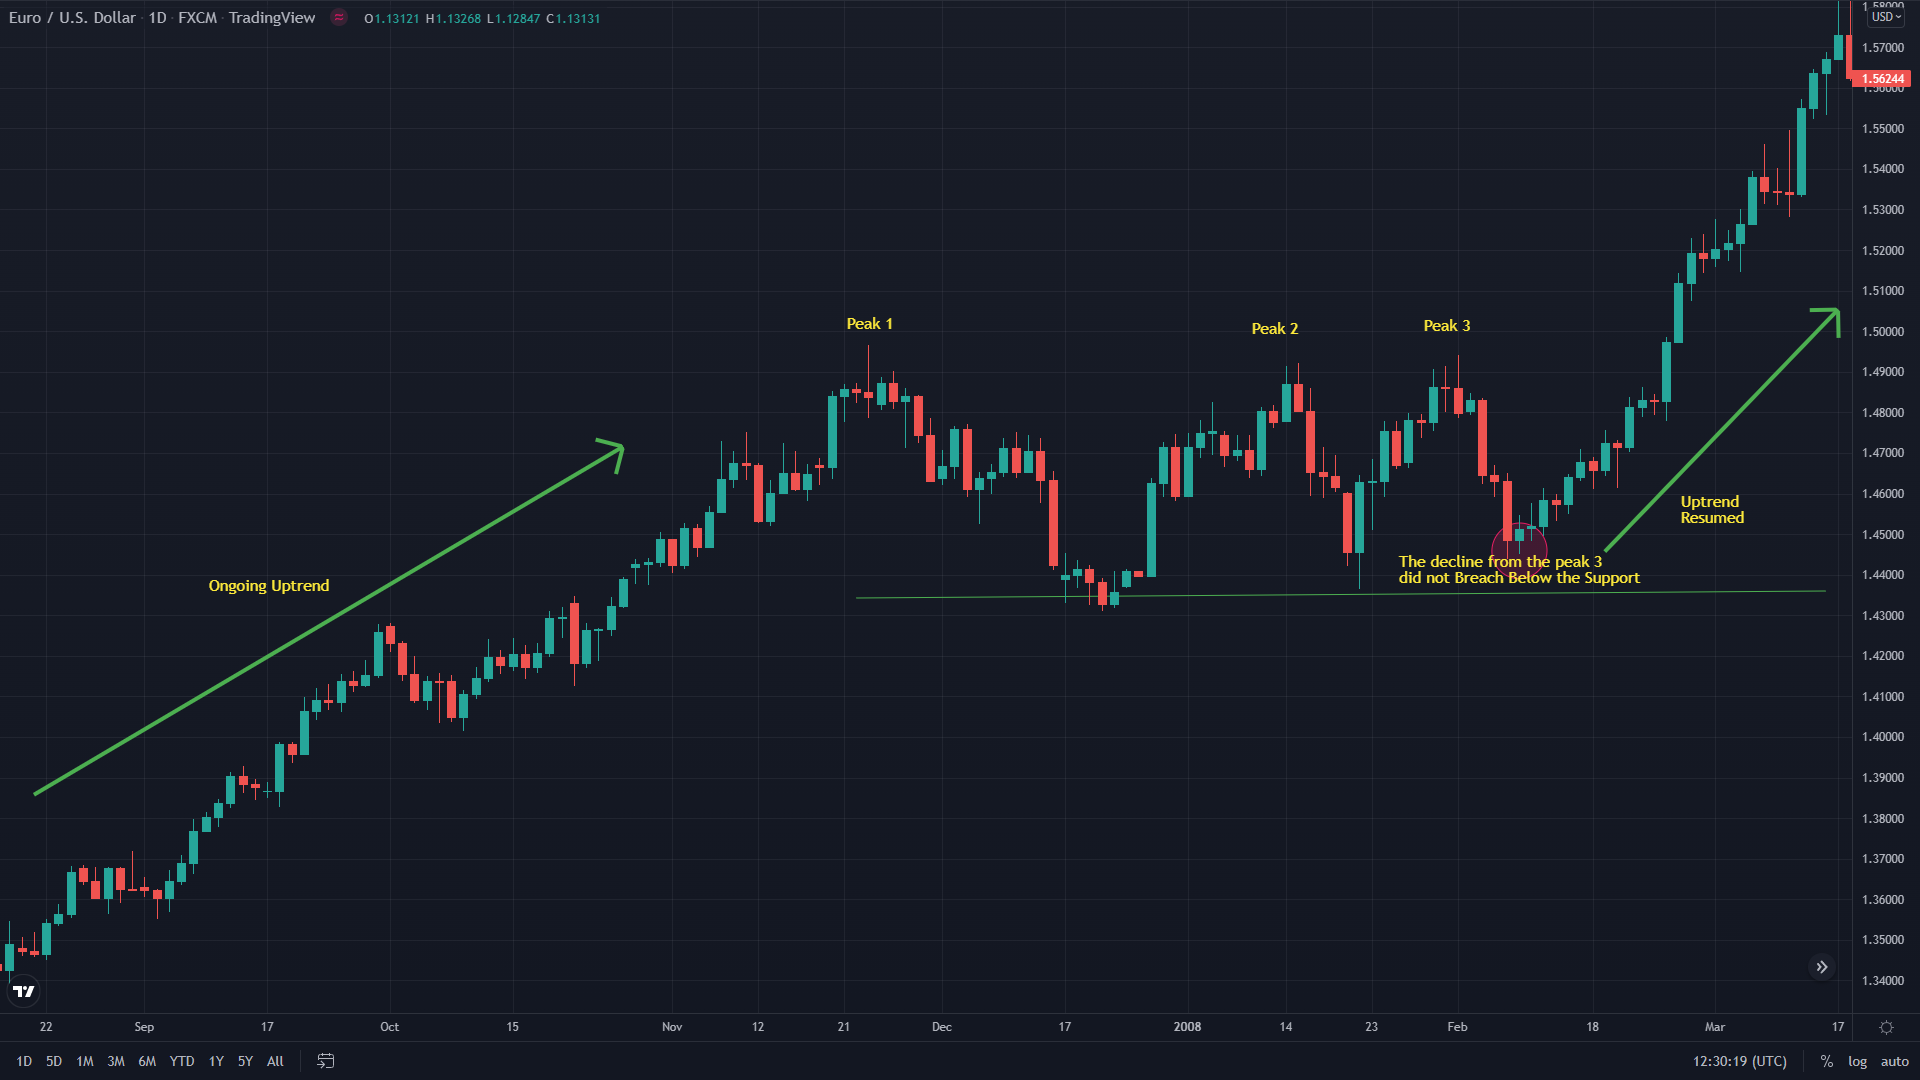
To understand it further let’s have a look at the following GBP/USD chart. On the chart, a strong uptrend is in place from 1.3400. The first decline started from 1.4900 and that created the first peak. Soon after dropping from the first peak, the pair gained some bullish momentum which again failed to accelerate near the previous peak. After some time the third peak started which again failed near the two previous peaks. At this stage, you may think that the triple top reversal pattern is formed but in practical trading, the signal is not yet confirmed. It is so because the price has not yet breached the newly established support area and the uptrend may resume anytime. In our example, this is exactly what happened as the decline from the third peak failed to breach below the support line, and the pair resumed the ongoing uptrend.
Trade Setup Using Triple Top Reversal Pattern
The triple top is considered a stronger reversal pattern compared to the double top reversal pattern and it presents great opportunities to benefit from a possible change in the ongoing trend. Since it is a bearish reversal pattern, it is ideal to enter a short trade after the support line between the peaks is breached. The support line can be established by looking at the price action and drawing a trend line. As a trader, you can raise the odds in your favor by entering the short trade after the support line is tested a couple of times.
A reasonable stop-loss for this trade remains above the recently breached support line which then acts as a resistance line. If you want to trade even more safely you can keep your stop-loss above the three peaks as it provides an extra cushion in the event of a sudden spike.
The take profit in this trade setup is generally kept just above the next support level. The take profit level can also be determined by using technical indicators. The RSI, MACD, and Moving average indicators can all help to determine the take profit level and maximize the profit. For example, if you use the RSI, you can continue holding the trade until the RSI reaches the oversold zone. Likewise, if you use the MACD you can close the position whenever there is a bullish crossover or when the MACD moves below the middle line.