Symmetrical Triangle Pattern
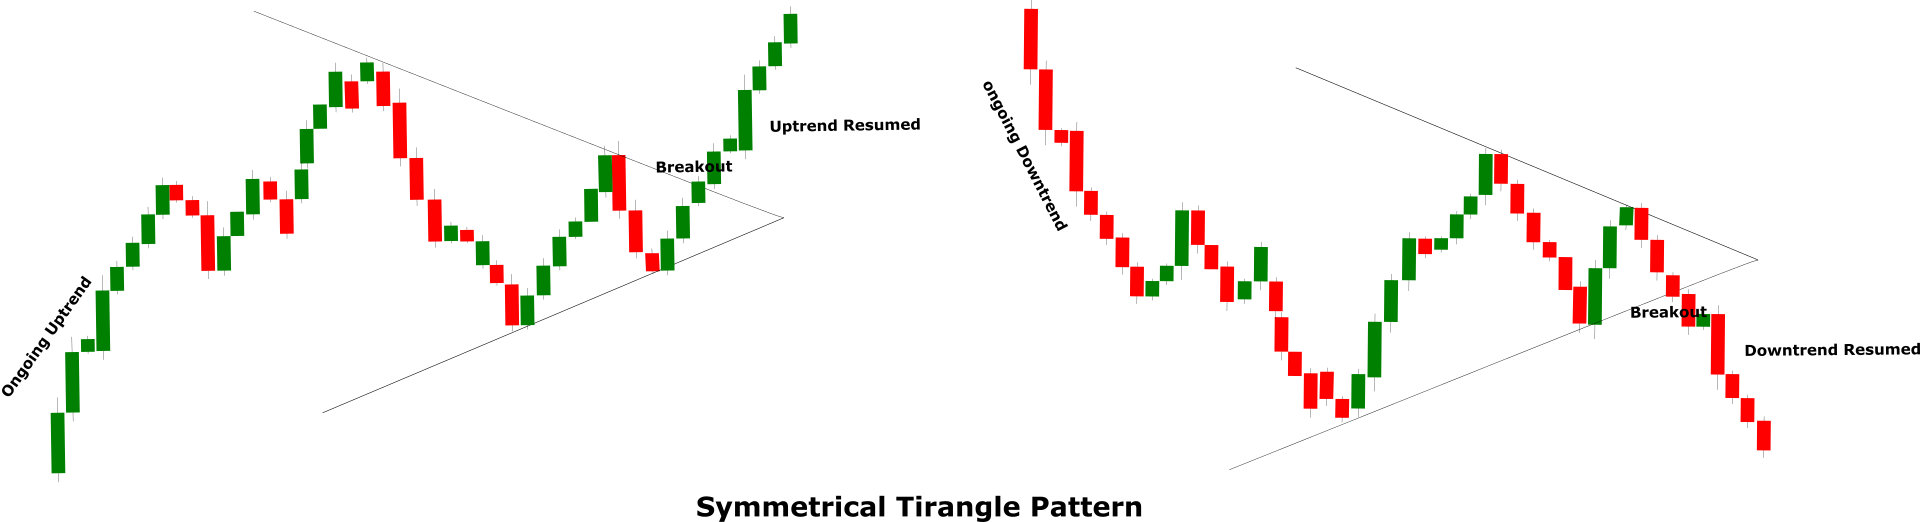
A Symmetrical Triangle pattern is a continuation pattern that is comprised of two slopping trend lines placed above each other. The trend lines are drawn by connecting a series of highs and lows. The upper trend line acts as a resistance line while the lower trend line act as a support line. A triangle represents price congestion and the pattern is usually formed when the price makes lower highs and higher lows. As the pattern progresses the two slopping trend lines contract and the price finally breaks above or below the trend lines which completes the pattern.
The symmetrical triangle pattern forms in both the up-trending and down trending markets. In a down-trending market, a breach below the support line completes the pattern and indicates the continuation of the downtrend. Conversely, in an uptrend, a breach above the resistance line completes the pattern and indicates the continuation of the uptrend.
Pattern Anatomy
The symmetrical triangle is a continuation pattern there for a previously established trend must be in place to validate the pattern. The duration of the prevailing trend should be from a few weeks to a couple of months. Remember the longer the duration of the trend the stronger the pattern will be.
The symmetrical triangle requires two trend lines and they should be slopping from the pattern. The breakout is only confirmed when the price breaks any of the trend lines.
A trend line in the symmetrical triangle pattern must connect at least two points. To draw the upper trend line (Resistance), the second high should be lower than the first high. Likewise, to draw the lower trend line (Support) the second low should be higher than the first low.
The volume should decline as the price progresses in the pattern meaning there should be lower highs and higher lows. If the volume does not decline the symmetrical triangle pattern will not form.
The duration of the symmetrical triangle should be between 2 to 4 weeks. If the pattern forms in a very small period it may produce a false signal.
The direction of the breakout should indicate the direction of the trend. If it’s an uptrend, the signal is only valid if the price breaks above the resistance line. Likewise, if the trend is downwards the signal is only valid if the price breaks below the support line.
Using The Pattern
Like any other reversal or continuation pattern, traders must take extra steps to identify the pattern and validate the signal. To validate the progress of symmetrical triangle pattern the volume is the key indicator and it must decline. If the volume does decline it would likely be a deceptive pattern. Traders should not jump into a trade right after the breakout and wait for at least two sessions to confirm the signal. Usually, the price returns to the breakout point before resuming the ongoing trend and that is considered a much safer opportunity to enter a trade. In addition, traders should look for the pullbacks and rallies in the symmetrical triangle, and if the lows or highs are extending then that might not be an ideal symmetrical triangle pattern. A volume increase towards the end of the pattern is generally an indication of a breakout and traders should closely observe it.
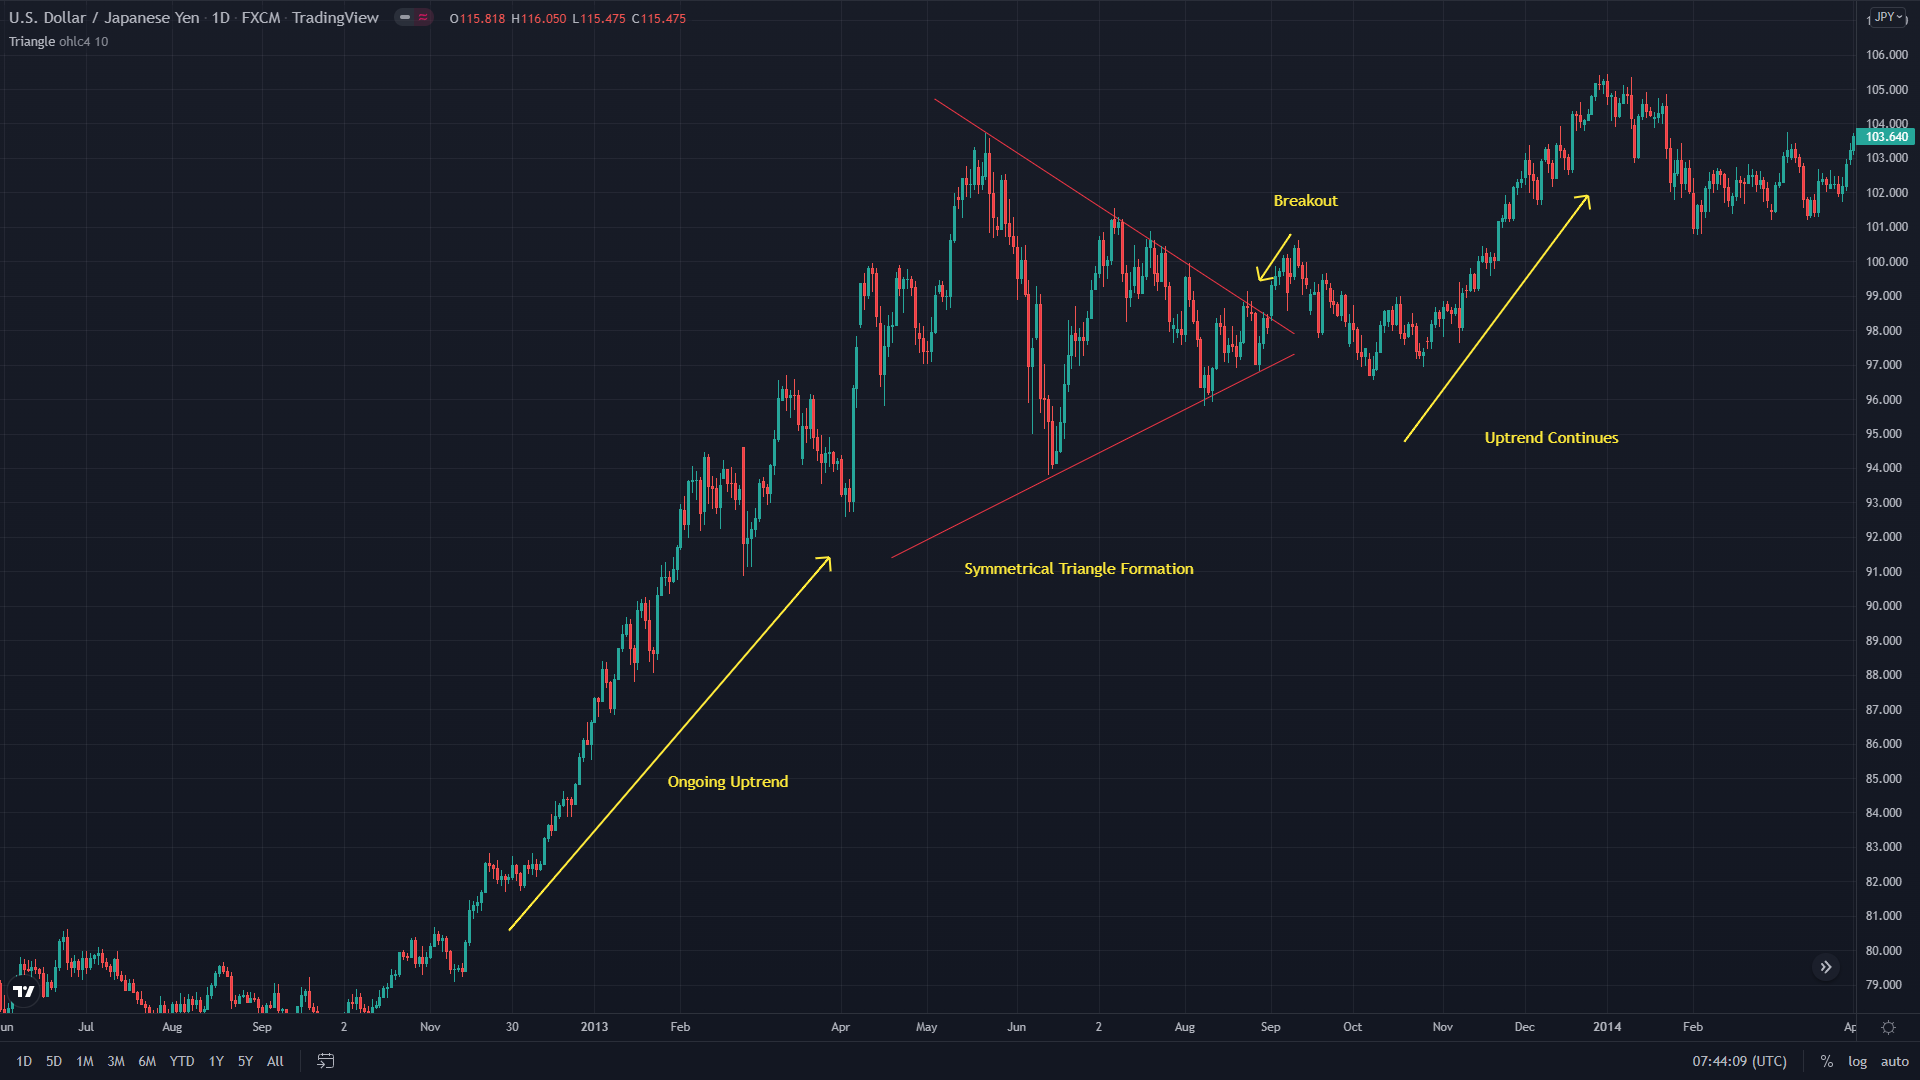
In the following chart of USD/JPY, a symmetrical triangle is established by drawing 2 slopping trend lines. The pair was in an uptrend from 80.00 until some correction took place around 103.000 towards 94.000. You can see the second high that is connected to draw the upper line (resistance) is lower than the previous high. Likewise, the low in the support line is higher than the previous low. The volume contracted and the pattern progressed until it breached above the resistance line near 0.9800. The breach above the resistance line completed the pattern and indicated the continuation of the ongoing trend. Since it was uptrend you can see the uptrend resuming and the price move higher towards 105.00
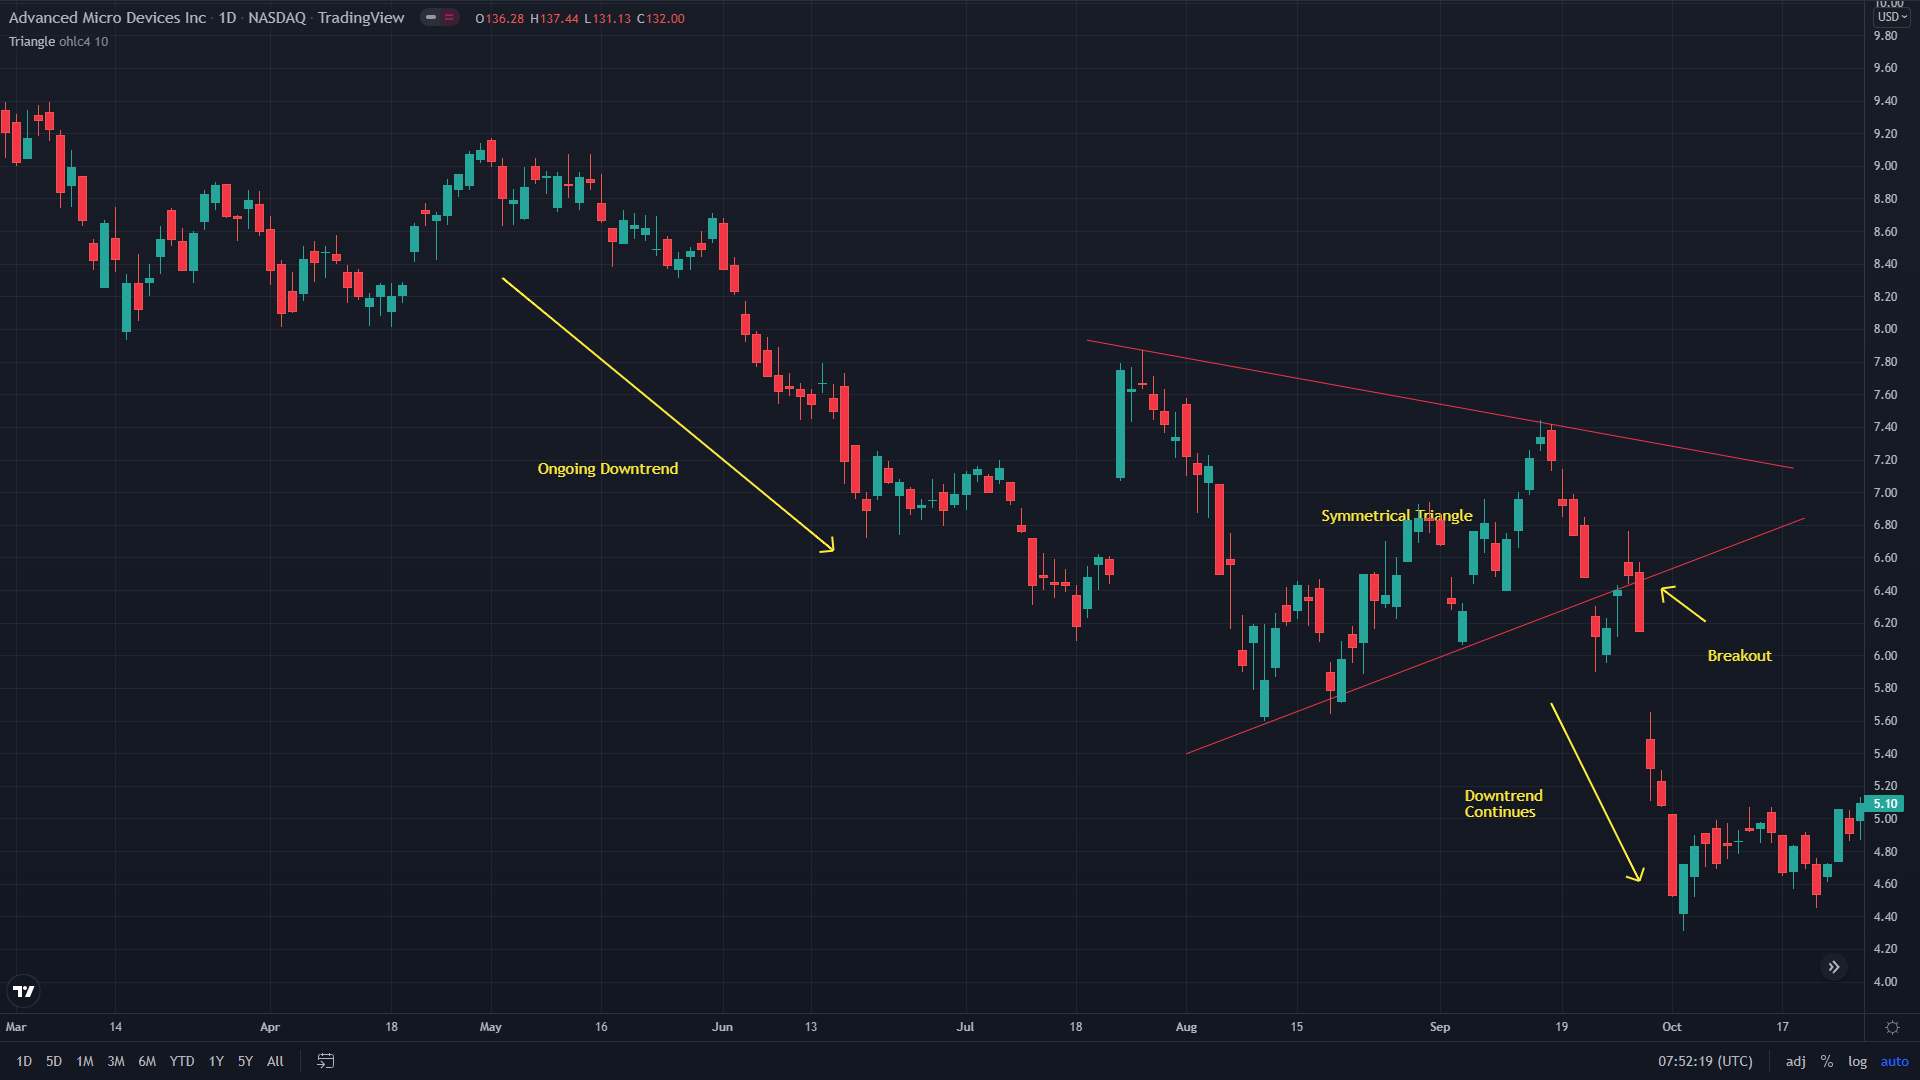
The following chart of Advanced Micro Devices Inc. (AMD) shows the significance of a symmetrical triangle pattern in a downtrend. The stock price was trending lower from $9.40 until around $5.00 it made some corrections towards $7.40. The upper line (resistance) in the Symmetrical triangle is connecting the two highs. You can also notice the second high is lower than the first high. The lower line (support) is connecting the lower lows while the second low is higher than the previous low. The price briefly moved with the triangle until it breached below the support line which completed the pattern and confirmed the continuation of the ongoing downtrend. Following the confirmation, you can see the downtrend resumed and the stock price moved lower towards $4.40.
Trade Setup Using Symmetrical Triangle Pattern
The symmetrical triangle pattern is a continuation pattern and that is why the pattern is generally used to place the trades in direction of the ongoing trend. Using this pattern the entry is placed near the breakout point. It is always a good practice to confirm the breakout by waiting for at least two sessions before entering the trade.
There are a couple of points to place the stop-loss using the symmetrical triangle pattern and the choice largely depends on trading style and the risk appetite. In case of an uptrend (buy), the stop-loss is placed in between in the middle of the support and resistance line. For long-term traders, the stop-loss will be just below the support line. Similarly, in the case of a. In case of a downtrend (sell), the stop is also placed in the middle of support and resistance lines. For the long-term trading goals, the stop-loss is generally placed above the resistance line.
The take profit in the scenario of a downtrend (sell) is placed just above the next support while in the uptrend (buy) the take profit remains just below the next resistance line. In both scenarios, the take profit can also be determined by using a technical indicator like a moving average or Bollinger bands.