Head and Shoulders Pattern
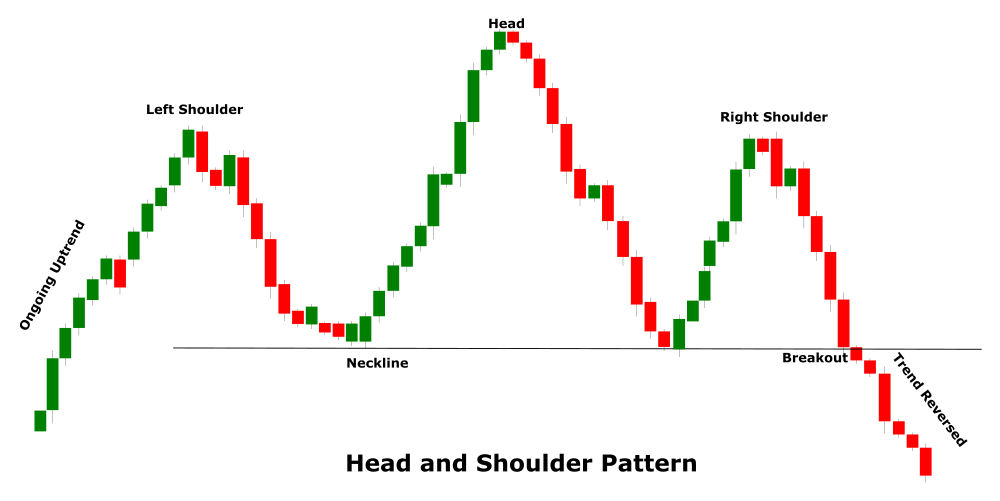
The Head and shoulders pattern is a bearish reversal pattern that forms in an uptrend and its completion indicates a possible reversal. The pattern is also called Head and Shoulder Tops and is comprised of three peaks that are followed by a decline. The two first declines are moderate while the decline from the third peak is substantial enough to mark the reversal. The middle peak in the pattern is the highest and is called the head. The peaks on the left and right of the head are called the left shoulder and the right shoulder. Both shoulder peaks remain below the peak of the head. The decline from the peaks is connected using a trend line and is called the neckline. The neckline acts as a support line and the pattern is confirmed when the decline from the third peak breaks below it.
Pattern Anatomy
The head and shoulders pattern is a strong reversal pattern which indicates the struggle between the market forces. Since it’s a bearish reversal pattern, it informs a trader about an oversupplied market or the declining demand which may cause the ongoing uptrend to reverse.
The left shoulder in the pattern gives the first sign of an oversupplied market which leads to a moderate decline. Following the decline the bullish force makes a strong come back and take the price higher than the left shoulder which creates the second peak or the head. However, despite a strong effort, the price drops again which further confirms that the market is oversupplied. Soon after the second decline from the head, the bulls make a third attempt to take control. The third attempt again fails and this time the price remains below even the previous peak (head) which indicates that bulls are now exhausted or in other words, the supply is overpowering the demand and the uptrend is likely to reverse.
The Head and shoulders pattern is a bearish reversal pattern therefore the pattern is only valid if it is formed in an uptrend. For a reliable signal, the uptrend should be in place from a few weeks to a couple of months.
The left shoulder is the first peak in the pattern and the decline from the left shoulder should be at least 10 to %15 of the total gain of the uptrend.
The head is formed when the price recovers from the low of the left shoulder and rises above its peak. The second peak (head) must be higher than the peak of the left shoulder.
The right shoulder is formed when the price recovers from the low of the head. The peak of the right shoulder should remain below the peak of the head but remains in line with the peak of the left shoulder.
The neckline is formed by connecting the lows of the left shoulder, and right shoulder. Ideally but not always the lows should be consistent. It is also normal for the neckline to slightly slope up or slope down. A slope down neckline indicates a stronger bearish momentum compared to a slope up neckline.
A signal from the head and shoulder reversal pattern is only confirmed when the decline from the right shoulder extends below the neckline. If it does not extend below the neckline the ongoing uptrend may resume anytime.
The volume plays an important role in the head and shoulder pattern. It should be higher when the price declines from the head while it should be lower when the price declines from the right shoulder. The volume again starts to increase when the decline from the right shoulder breaks below the neckline.
The neckline in the pattern acts as a support level. However, after the price breaks below the neckline, its role is reversed and it acts as a resistance line.
Once the neckline is breached, the distance between the neckline and the peak of the head can be measured and used for take profit. However, this only serves as a rough guideline and a trader should also consider various other factors to determine the price target.
Using The Pattern
The head shoulder pattern is a common reversal pattern and it indicates a major trend reversal. To maximize the gains and avoid substantial losses a trader must correctly identify the pattern. The identification of the neckline is the key factor because it confirms the final signal. The volume is also a deciding factor in this pattern that traders should never ignore. A divergence between the volume and the price movement can well be an indication of a fakeout. The traders should always make sure that the volume is high near the head and low near the right shoulder.
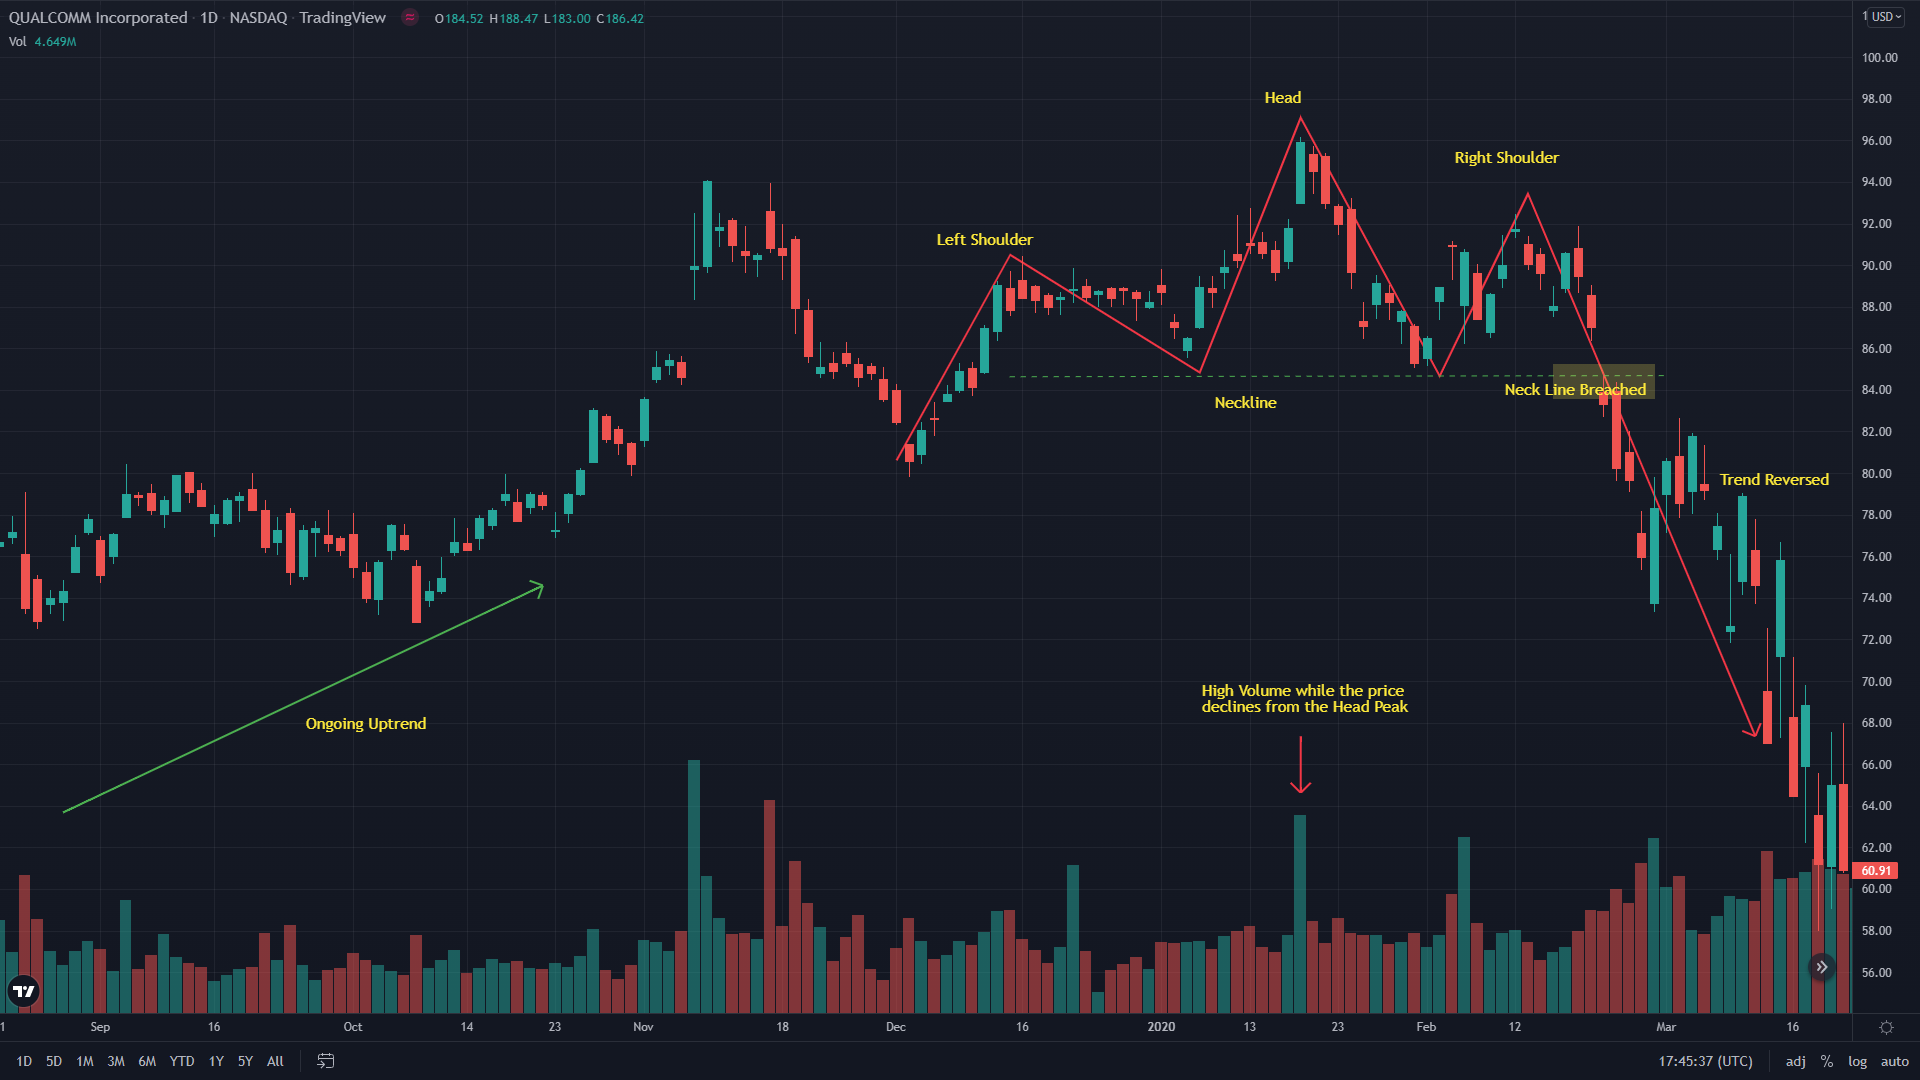
The following chart of Qualcomm Inc (QCOM) is an excellent example to understand the implication of the head and shoulders pattern. The stock was in an uptrend from $67 until around $90 a lower move formed the left shoulder of the pattern. After a moderate decline, the share price once again resumed the uptrend and moved above the left shoulder. However, the bulls couldn’t sustain at the peak and the share dropped to the low of the left shoulder. The second drop created the head of the pattern. Soon after declining from the head, the bulls made the third attempt to take the price higher. This time the bulls failed badly and remained well below the head. This created the right shoulder and the neckline is drawn by connecting the lows of the left and right shoulders. The share then dropped for the third time and finally breached below the neckline which confirmed the bearish signal. Following confirmation, you can see the trend reversed and the share price continued to drop in the coming sessions.
Trade Setup Using Head and Shoulders Pattern
The head and shoulders pattern indicates a major trend reversal and only a proper trade setup can help to benefit from a large movement. Since it is a bearish reversal pattern an ideal place to enter a sell trade is when the neckline is breached. Remember once the neckline is breached it acts as a resistance line. To minimize the risk, traders can place the sell entry once the neckline line is tested a few times.
In this trade setup, there are a couple of places to keep the stop-loss. The first place to keep the stop-loss is just above the right shoulder while the second option is to keep the stop-loss above the head. The stop-loss above the head is considered safer as it offers added protection in the event of a sudden price fluctuation. However, the position of the stop-loss largely depends on your risk appetite and trading style and it can be adjusted accordingly.
When trading the head and shoulders pattern, the take profit is usually determined by measuring the distance between the neckline and the peak of the head. For instance, if you are trading Forex and the distance between the neckline and the peak of the head is 100 pips then your potential take profit will also be 100 pips. However, this is just a guideline and you can adjust the take profit based on the price action and nearby support levels. Traders also use Fibonacci retracement or a long-term moving average to place the take profit.