Wedge Patterns
A wedge pattern is a reversal pattern that can indicate both the bullish and the bearish price reversals. A wedge that indicates a bullish reversal is called the Falling Wedge Pattern and the one that indicates a bearish reversal is called a rising wedge pattern.
Regardless of the bullish or bearish wedge pattern, the pattern is comprised of two sloping trend lines placed above each other. The upper trend line connects the higher highs and acts as a resistance line. The lower trend line connects the lower lows and acts as a support line. The price action remains contained within the slopping trend lines and the volume declines as the price progresses in the pattern. The declining volume causes the wedge to contract and that eventually leads to a breakout. The breakout completes the pattern and indicates a reversal.

Pattern Anatomy
In financial markets, a sustained upwards or downwards movement is generally followed by a reversal. In a wedge pattern, the loss of the upside or downside momentum indicates a bullish or bearish bias. For example, in the Falling Wedge Pattern (bullish) when the lows start to contract it indicates the bears are getting exhausted and may lose control. The contracting lows are basically an indication of rising demand or lower supply which causes the price to rise. Conversely, in the Rising Wedge Pattern (bearish) when the highs start to contract it indicates that the bulls are losing control and the uptrend is likely to reverse. In simple words, consecutive lower highs indicate the declining demand or the rising supply which causes the price to fall.
In an ideal situation, a wedge pattern should be formed after a long period of upwards or downwards movement.
To form a resistance line in a wedge pattern connects at least two or more highs. Each high that is connected should be higher than the previous high.
To form a support line in a wedge pattern connects at least two or more lows. Each low that is connected should be lower than the previous low.
The slope of the wedge plays an important role in the pattern, the bigger the slope of the wedge is the greater the chances of a breakout are.
The volume is an important characteristic of the wedge pattern. The volume declines as the price progress in the pattern and it increases when the price is about to breakout. The chances of a breakout will be further higher when the volume increase comes after an extended period of low volume.
The pattern will not be confirmed until there is a breakout. In the Falling Wedge Pattern (bullish), the price breaks above the resistance line while the in Rising Wedge Pattern (bearish) the price breaks below the support line.
Using The Pattern
A Wedge Pattern is one of the difficult patterns to spot and trade. Like any other pattern, you need to take extra steps to correctly recognize It. The size of the wedge is very important and should not be ignored. If the wedge size is too small it will likely produce a false. It is important to connect multiple points to draw the support and resistance lines. The lines that connect multiple points are considered stronger compared to the ones that only connect one or two points. It is also important to keep an eye on the volume and there shouldn’t be any divergence between the volume and the price action. The breakout completes the pattern, but to remain on the safe it’s a good practice to refrain from entering the trade for the next couple of sessions.
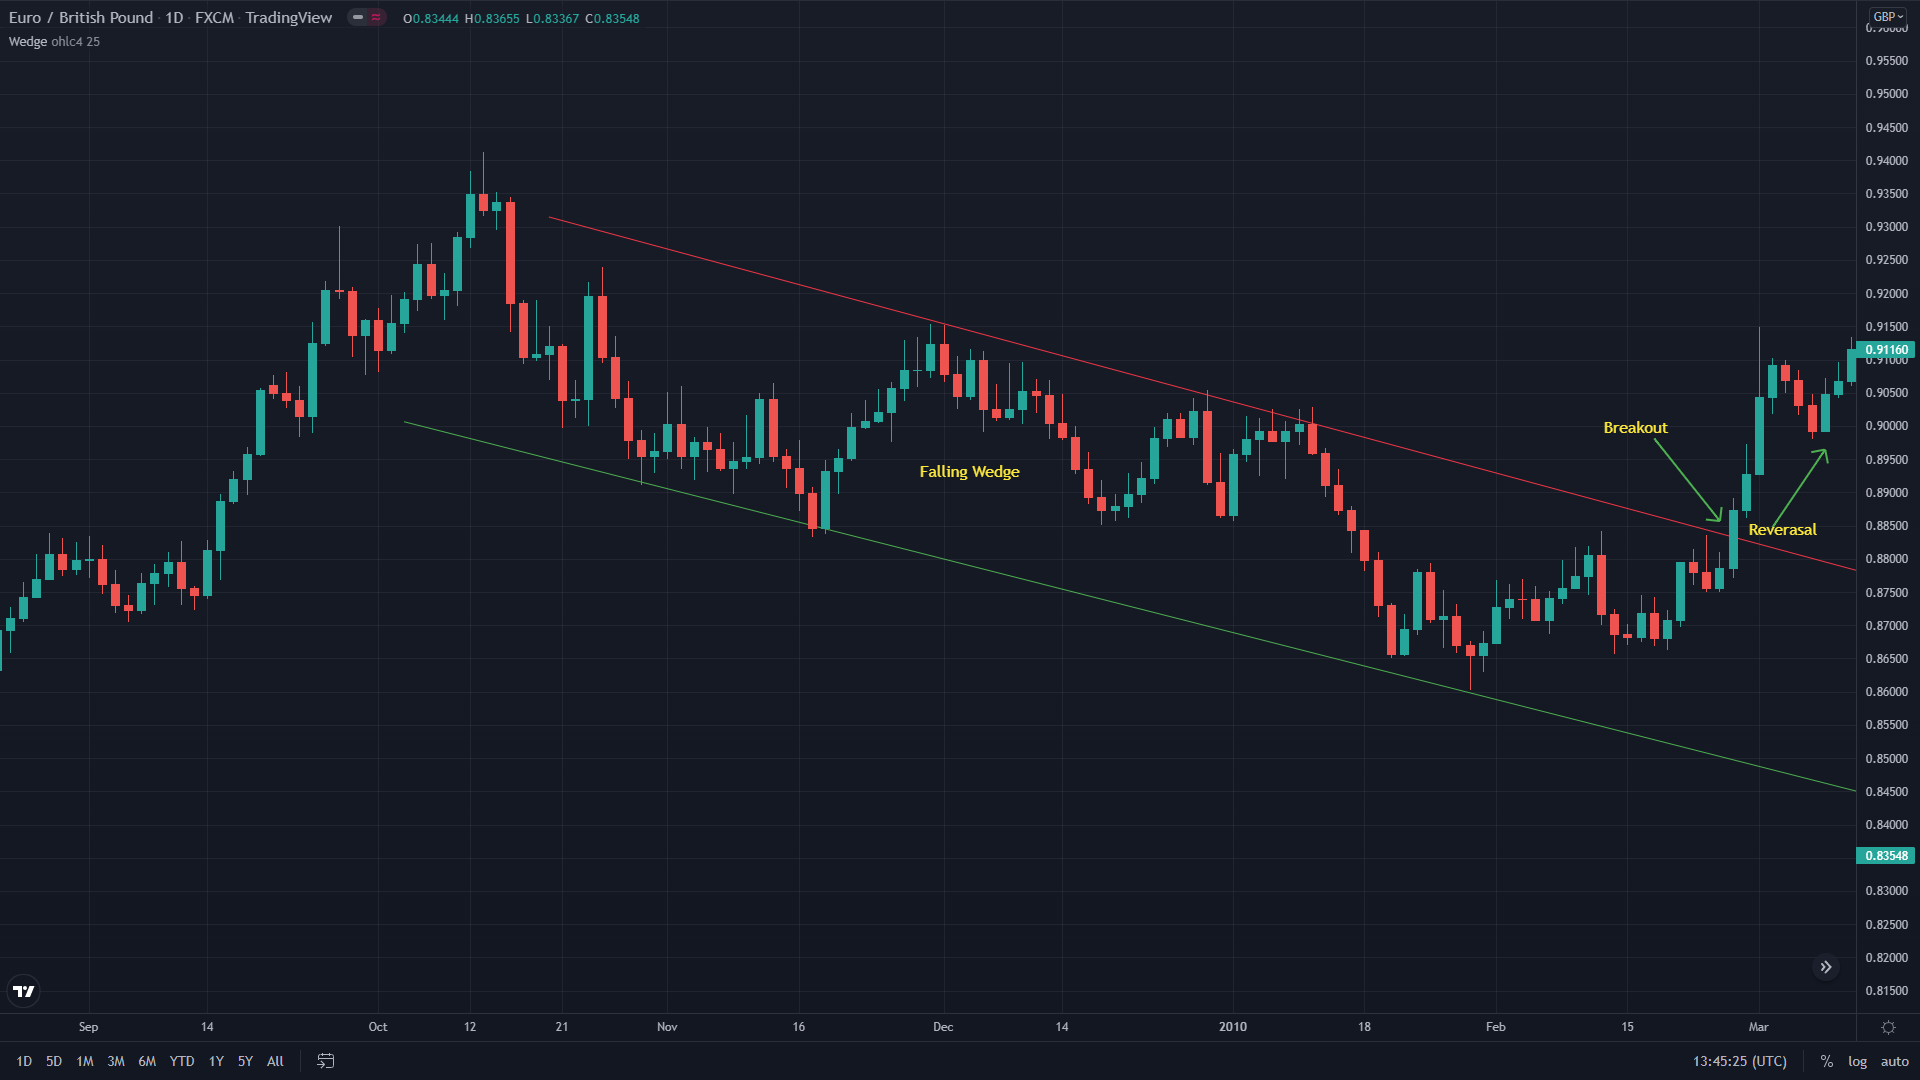
The following chart of EUR/GBP is an excellent example of a falling wedge which is a bullish reversal pattern. The pair started to trend lower from almost 0.9400. The support line is connected using the lower lows and the upper resistance line is formed by connecting the higher highs. In the wedge, the highs kept shrinking while the lows can be seen extending. Towards the end of the pattern, the shrinking candlesticks are also indicating a lower volume. Finally around 0.88000 the price broke above the resistance line which completed the Falling Wedge Pattern and indicated the reversal. Following the reversal signal, you can see the pair gradually moved higher towards 0.9100
A Wedge Pattern is one of the difficult patterns to spot and trade. Like any other pattern, you need to take extra steps to correctly recognize It. The size of the wedge is very important and should not be ignored. If the wedge size is too small it will likely produce a false. It is important to connect multiple points to draw the support and resistance lines. The lines that connect multiple points are considered stronger compared to the ones that only connect one or two points. It is also important to keep an eye on the volume and there shouldn’t be any divergence between the volume and the price action. The breakout completes the pattern, but to remain on the safe it’s a good practice to refrain from entering the trade for the next couple of sessions.
The following chart of EUR/GBP is an excellent example of a falling wedge which is a bullish reversal pattern. The pair started to trend lower from almost 0.9400. The support line is connected using the lower lows and the upper resistance line is formed by connecting the higher highs. In the wedge, the highs kept shrinking while the lows can be seen extending. Towards the end of the pattern, the shrinking candlesticks are also indicating a lower volume. Finally around 0.88000 the price broke above the resistance line which completed the Falling Wedge Pattern and indicated the reversal. Following the reversal signal, you can see the pair gradually moved higher towards 0.9100
Trade Setup Using Wedge Patterns
Although it is difficult to identify a wedge pattern once it is identified the trading setup using the pattern is fairly easy. In the Falling Wedge Pattern (bullish) a buy trade is generally placed after the price breaks above the resistance line. For a safer entry, it is always a good practice to refrain from entering the trade immediately after the breakout. The next couple of sessions will help you to validate the breakout.
The stop-loss placement largely depends on your trading style and risk appetite. Generally, if you are a short-term trader you can place the stop-loss in the middle of support and resistance lines. If you are a long-term trade it will be wise to keep the stop-loss below the support line. Although this stop-loss will be quite far from the entry it will give added protection against sudden movement and you will be able to achieve your long-term target.
The take profit in this trade setup is generally kept just below the next resistance area. The resistance area is identified by analyzing the price chart. You may also use a technical indicator like the moving average or the RSI to determine the exit level. Many traders also measure the maximum distance between the support and resistance lines of the wedge and use that for placing the take profit.
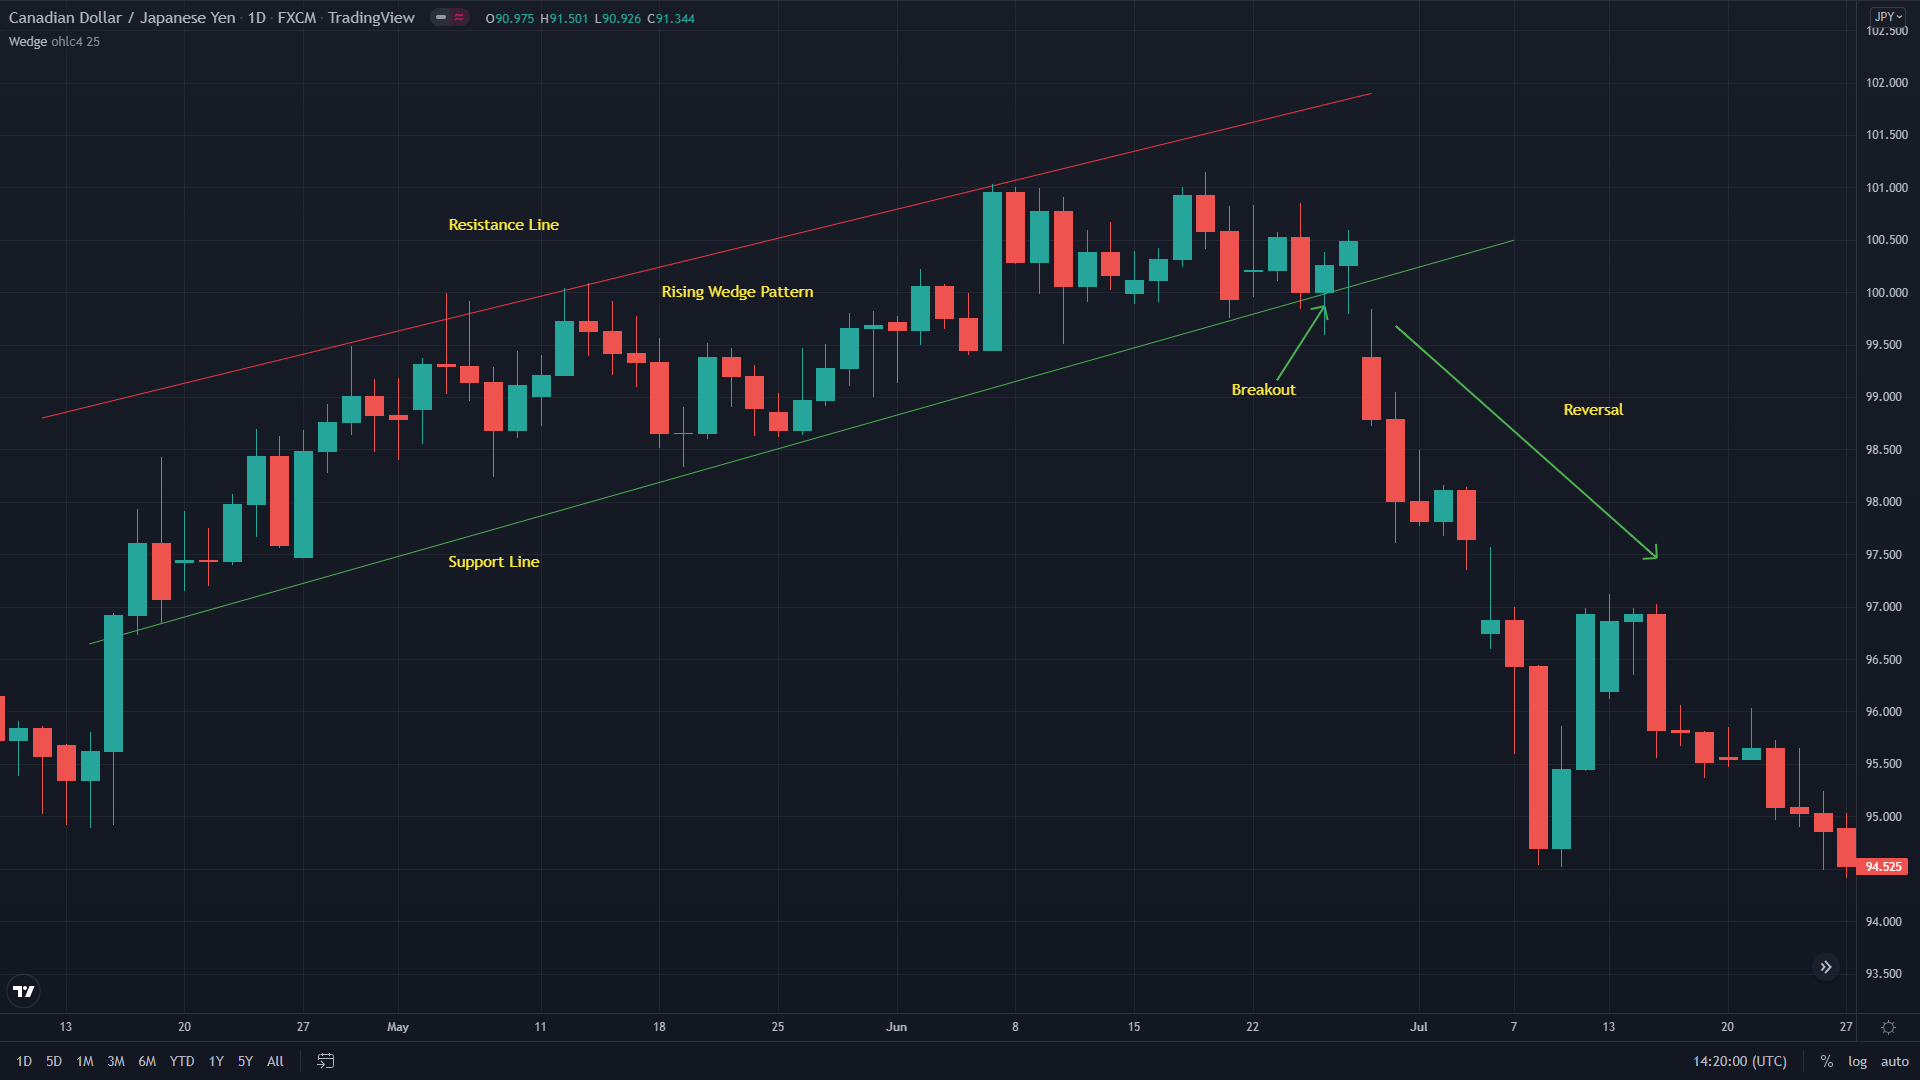
In the scenario of a Rising Wedge Pattern (bearish) a similar approach is adopted. You can take a sell entry once the price breaks below the support line. You may wait for a couple of sessions to validate the breakout.
Like the falling wedge pattern, the stop-loss using the Rising Wedge Pattern can be kept either in between support and resistance lines or you can place that above the resistance line for added protection. The take profit is kept just above the next support level. Once again you may also use a technical indicator to determine the take profit level or you may measure the distance between the support and resistance line and use that distance for placing the take profit.