Descending Triangle Pattern
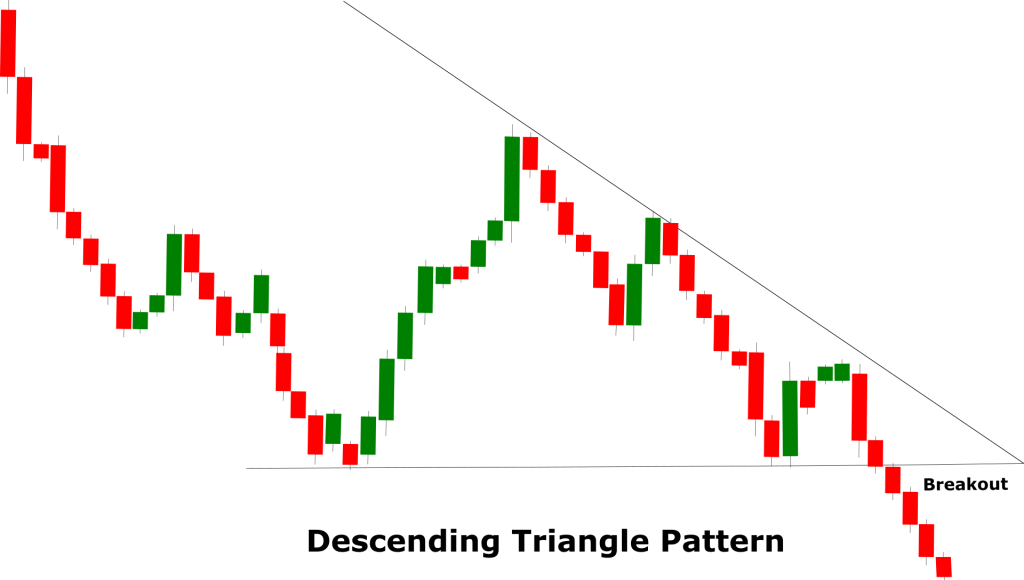
The Descending Triangle pattern is a bearish continuation pattern that forms in a down-trending market and indicates the continuation of the downtrend. Like any other triangle pattern, the descending triangle pattern is also comprised of two trend lines that are drawn above and below each other and converge towards the end of the pattern.
Contrary to the ascending triangle pattern, in the descending triangle pattern, the lower trend line is horizontal and it is drawn by connecting two or more equal lows. The upper trend line in the pattern slopes downwards and is drawn by connecting two or more highs. The second high in the upper trend line remains lower than the previous high. The upper trend line (sloping) acts as a resistance line while the lower trend line (horizontal) acts as a support line. A breakout below the support line completes the pattern and marks the continuation of the ongoing downtrend.
Pattern Anatomy
The descending triangle pattern is a bearish continuation pattern therefore it requires a prior downtrend that should be in place from a couple of weeks to a month.
The lower line in the Descending triangle pattern is horizontal and it should be drawn by connecting a minimum of two equal highs. If the horizontal trend line is drawn by connecting more than two lows the pattern is considered stronger.
The upper trend line in the pattern should slope downwards and it should be drawn by connecting at least two highs. If the upper trend line is not sloping the descending triangle pattern cannot be validated.
The upper and the lower trend lines should converge towards the end of the pattern and the pattern will complete only when the price breaks below the horizontal support line.
The volume should decline as the pattern progresses meaning the trading range should get narrower. If the volume does not decline the pattern is unlikely to form and cannot be validated.
The duration of the descending triangle should be between a few weeks to a couple of months. If the pattern forms too quickly it is likely to indicate a fake signal.
After the breakout, the role of the support line (horizontal line) reverses and it acts as a resistance line. Traders should wait a couple of sessions to confirm the breakout.
Using The Pattern
Like any other reversal or continuation, pattern traders need to take extra steps to correctly identify the pattern and read the signal. The descending triangle pattern is a bearish continuation pattern and it will be valid only if it forms in a sideways or up-trending market. The volume also plays a key role in the descending triangle pattern. Usually, the volume declines as the pattern progresses and it increases near the breakout. For these reasons, traders should perform the volume analysis to validate the pattern and also to anticipate the breakout. Traders should also observe the pullbacks and the rallies within the descending triangle pattern. If there are extended lows and highs it may turn out to be a deceptive pattern.
The following chart of Adobe Inc. (ADBE) shows the significance of descending triangle pattern. The share was in a downtrend from nearly $50 until it made some correction from $39 towards $45. The upper trend which slops downwards is drawn by connecting the highs. The second high that is used to draw the trend line is lower than the previous high. The lower support line is horizontal and is drawn by connecting two equal lows. In the middle of the pattern, the candlestick bodies started to shrink which indicated the low volume. As the pattern progressed the share price finally breached below the horizontal support line which completed the pattern and signaled the continuation of the downtrend. Soon after the signal, you can see the downtrend resumed and the share price gradually dropped towards $32.
Trade Setup Using Descending Triangle Pattern
The descending triangle pattern is a bearish continuation pattern therefore it is used to place short (sell) trades. In this trade setup, the entry is taken near the breakout point. The price usually moves back a couple of times after the breakout therefore it is ideal to wait for a couple of sessions to confirm the breakout.
The stop-loss in this trade setup generally remains above the horizontal support line. Remember once the support line is breached it acts as a resistance line. For long-term traders, a stop-loss above the horizontal trend line may well be too close to the entry point that is why it can be extended just above the upper trend line. Keeping the stop-loss above the upper trend line gives extra protection in the event of a sudden spike. Having said that, the position of the stop-loss largely depends on the trading style and the trader’s risk appetite.
The take profit in this trade setup is generally kept just above the next support level which is identified by visually analyzing the price chart. The take profit can also be determined by analyzing the strength of the downwards rally that occurs following the breakout. Traders can also use technical indicators like the Bollinger bands, moving average, or the RSI to identify the exit levels.
The stop-loss position largely depends on your risk appetite and trading style. You can either keep your stop-loss above the recently breached support line which then acts as a resistance line or you can keep it above both the peaks in the pattern.
The first place to keep the stop-loss is above the recently breached support line which now acts as a resistance line. The second place you can keep the stop-loss is just above both the peaks. Although the stop-loss above the peaks will be far from the entry level it offers and added protection in the event of a sudden spike.
There are multiple ways to determine the take profit. Usually, the take profit is kept above the next support level. You can determine the support level by analyzing the price action and using the trend lines. Another method to determine the take profit is by using a technical indicator like the moving average or RSI. The moving average line act as dynamic support or resistance area. In the case of the Double Top Reversal pattern, if the moving average line is below the current price you can keep your take profit just above that. Likewise, the RSI can also help to determine the exit level. As a general rule of thumb, if the RSI is below the neutral zone (below 50), you can continue holding your position and close the trade just before the RSI enters the oversold zone (30).


