WYCKOFF Volume Spread Analysis
The volume spread analysis is a unique method and it is mainly used by banks and professional traders. Surprisingly the method is not discussed too often. In this tutorial you will learn all about volume spread analysis using the Wyckoff’s theory. You will learn about its components and 4 four different stages of the price cycle. Towards the end of this tutorial you will be able to analyze the volume and predict the future price movement. The analysis requires the volume indicator that is available on all modern trading platforms.
What is Volume Spread Analysis (VSA)?
The Volume Spread Analysis is the study of Price concerning its corresponding volume. The study is used to identify the underlying reasons behind the market movement or its behavior. In other words, if a trader anticipates a bearish or bullish movement then there must be an underlying reason behind it. The Volume Spread Analysis tracks down the professional activity or the moves of the smart money. The Smart Money in this context is the Big Banks Hedge Funds and Large Financial Institutions that have the big pockets to move the market the way they want.
What is Wyckoff's Theory?
Wyckoff’s theory was initially presented in the early 20th century by Richard Wyckoff. The analysis of the supply and demand through the examination of the trading volume is the central pillar of Wyckoff’s theory. The theory was initially used for the stock market. However with time it has evolved and with all the changes it remains relevant with the modern-day markets.
According to Wyckoff a high volume in a market comes from professional traders while the low volume shows that professionals are not interested in buying. The theory further elaborates that the prices can be manipulated but the volume cannot. So by analyzing the volume one can eliminate the subjectivity from trading and that can help to understand the market psychology and its sentiments. According to the theory a price cycle has four stages. We will discuss these stages in the latter part of this video.
Advantages of Volume Spread Analysis
The Volume Spread Analysis can be used in any market like Forex stocks indices commodities and Futures. Many people might argue that Forex Volumes are useless as it is a decentralized market and has no real volume. However, Forex has Tick Volumes which is a proxy to real volumes and correlates it 90% of the time.
The Volume Spread Analysis (VSA) can be applied to any timeframe meaning it is equally useful for day trading swing trading or even scalping.
The factors that distinguish the Volume Spread Analysis (VSA) from other methods of analyses are Its non-subjectivity and its ability to detect the big player’s manipulation which helps to indicate the cause of imbalance between the supply and demand.
Volume Spread Analysis components
There are five components of volume spread analysis. These components are compared to analyze and predict the future price movement.
The first component is the spread. It is the difference between the opening and closing prices.
The second component is the volume. It is the frequency of transactions during a specified period. The bigger the volume histogram bar the higher the volume is. Likewise the smaller the bar the lower the volume is.
The third component is the Bearish and Bullish Volume. Bearish Volume is marked in Red and it shows bearish activity. The Bullish Volume is marked in green and it shows bullish activity.
The fourth component is the Above Average High Volume. It is the Highest Average Volume in the current session. Average Volume is the volume that coincides with 20 periods of Moving Average.
The fifth component is the Ultra High Volume and it is the Highest Volume in the current session.
Four Stages of Price Cycle
According to the Wyckoff theory a price cycle has four stages. Lets’ learn about these stages one by one.
Accumulation
In a price cycle the accumulation stage occurs when Supply and Demand are in balance with each other.
Mark Up
The mark-up stage occurs when the demand increases than the supply. In this stage a bullish rally is observed and it generally happens after the completion of the accumulation process.
Distribution
The distribution stage occurs when Supply and Demand are in the balance after an exhausting mark-up move.
MarkDown
The mark downstage occurs when Supply becomes more than Demand. It causes a drop in the price and it happens after a distribution stage.
How To Use Volume Spread Analysis?
The volume spread analysis is ideal for both the bullish and bearish markets. The analysis helps to find a trading signal using the signs of weakness and the signs of strength. These signs basically indicate the change in demand and supply.
The signs of weakness indicate exhausted buyers or in other words they indicate an increase in supply. The increased supply causes the market to fall.
Likewise the signs of strength indicate the exhausted sellers or in other words they indicate an increase in demand which leads to the rise in the price.
Let’s first learn the different signs of strength. Remember these signs are valid only if they appear in a down-trending market.
Down Thrust
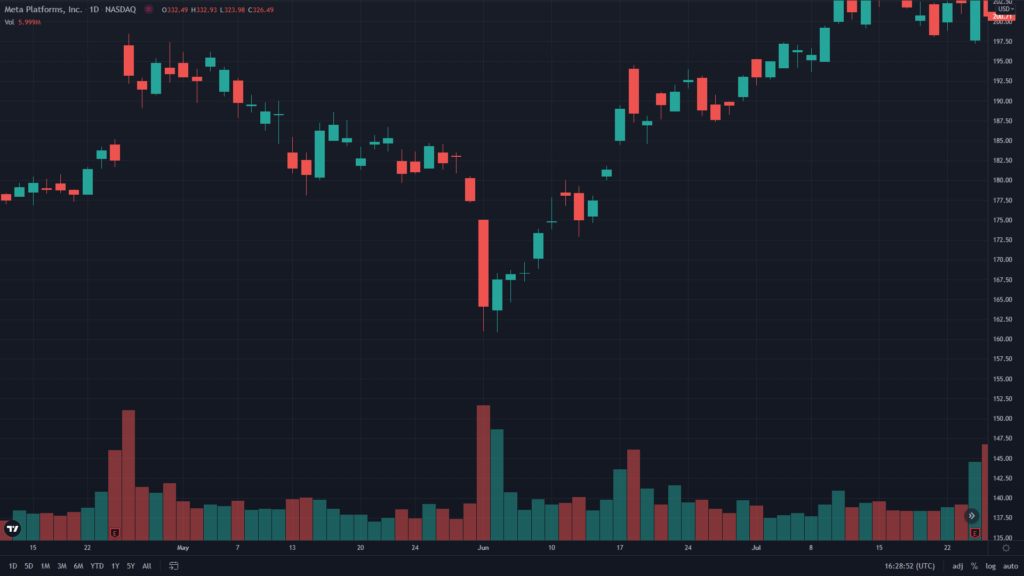
Down thrust is the bullish pin bar. or the Doji bar. It has an ultra-high or above-average high volume. The Spread of the down thrust bar is extremely low. meanwhile the volume is relatively high. The volume spread analysis suggests. that if the spread is low then the volume should also be low. So the down thrust indicates a divergence between spread and volume. and it signifies that there is more demand or the sellers are under pressure. Therefore the price is likely to rise in the future.
In this example this down thrust bar has an ultra-low spread while the volume is high. The down thrust indicated high demand which is a bullish signal and you can see the price increased following the bullish signal.
Selling Climax
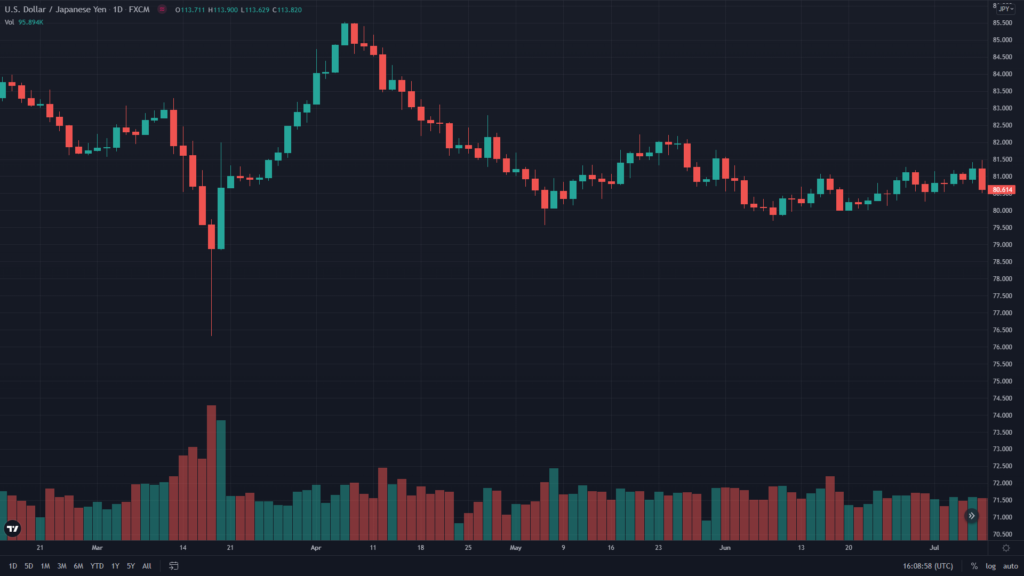
Selling Climax is a high spread bearish candlestick that closes well above its low. It has a noticeable downwards wick whose size is approximately 20% of the candlestick body size. It has an ultra-high or above-average high volume.
The rejection from the low along with the high volume bar indicates that the market has more demand than supply and the price is likely to rise in the coming sessions.
In this example we have this high spread bearish candlestick that closed approximately 20% above its low. The volume bar in this session is indicating an ultra-high volume. The spread and the volume analysis suggest there is high demand or the sellers are under pressure. Following the bullish signal you can see a noticeable rise in the price.
Low Bearish Spread With Low Bearish volume
In this sign of strength a candlestick has a large bearish spread than the previous candlestick but its volume is lower than the previous candlestick volume. The volume spread analysis suggests that there should not be any result without any effort. Here the effort refers to the volume while the result refers to the spread. So the large bearish spread is in disagreement with the low volume which indicates a lower supply and that can possibly push the price higher in the coming sessions.
In this example we have a high bearish candlestick whose spread is larger than the previous candlestick and its volume is lower than the volume of the previous candlestick. The volume spread analysis signifies a disagreement between the spread and price and indicates a possible increase in the demand which is a bullish signal. Following the signal you can see the price significantly gained before taking the next dip.
Low Bearish Spread With Higher Bearish Volume
In this sign of strength a candlestick has a low bearish spread compared to the previous candlestick but its volume is higher than the previous candlestick volume. The volume spread analysis suggests that there should not be any result without any effort. Here the effort refers to the volume while the result refers to the spread. So the low bearish spread is in disagreement with the high volume which indicates a higher upcoming demand and that can push the price higher.
In this example this candlestick is having a low bearish spread compared to the previous candlestick. But the volume of this candlestick is higher than the volume of the previous candlestick and it is a disagreement between the spread and volume. Following the disagreement you can see the falling price gradually started to rise.
No Supply Bar
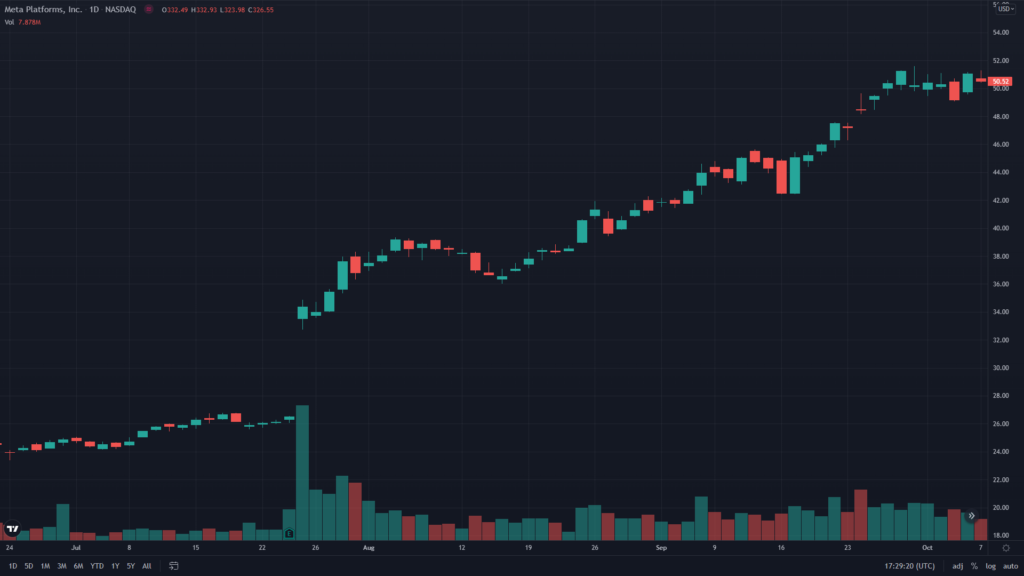
No Supply Bar This is a low spread bearish candlestick having a downward wick. Its volume is lower than the previous two candlesticks volume. No Supply bar means that there is a lack of supply and demand is overpowering supply causing the price to rise in the future. Please note that No Supply Bar is a continuation signal not a reversal signal. No supply bar is effective only if it appears after bullish momentum or appears after Sign of Strength in the direction of the trend.
In this example we have a low spread candlestick with a downwards wick. The volume bar in this session is lower than the volume of the two previous sessions. The volume spread analysis suggests a lack of supply and since this is happening in an ongoing uptrend the No supply bar suggested the continuation of the ongoing trend and you can see the price gradually kept rising in the coming sessions.
Now let’s learn the signs of weakness. Remember these signs are valid if they appear in an up-trending market.
Upthrust
Upthrust is the bearish or Doji candlestick whose spread is extremely low while the volume is relatively high. According to the volume spread analysis if the spread is low then the volume should also be low. So the upthrust is a disagreement between spread and volume which signifies that there is more supply than demand and it may cause the price to fall in the coming sessions.
In this example this upthrust candlestick has a low spread while the volume is relatively high. The upthrust candlestick and the high volume bar indicate the lower demand which is a bearish signal and you can see the price significantly dropped following the bearish signal.
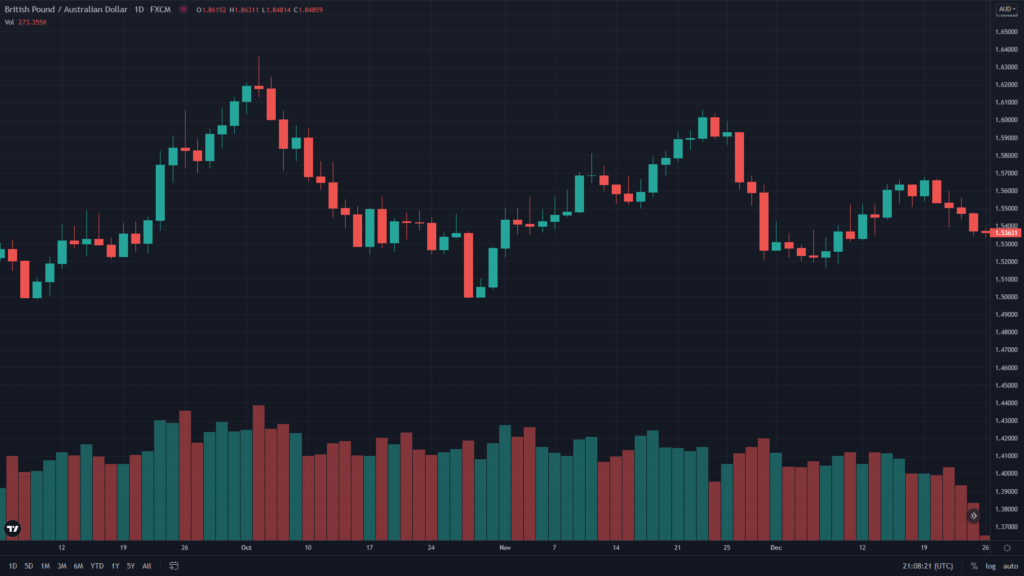
Buying climax
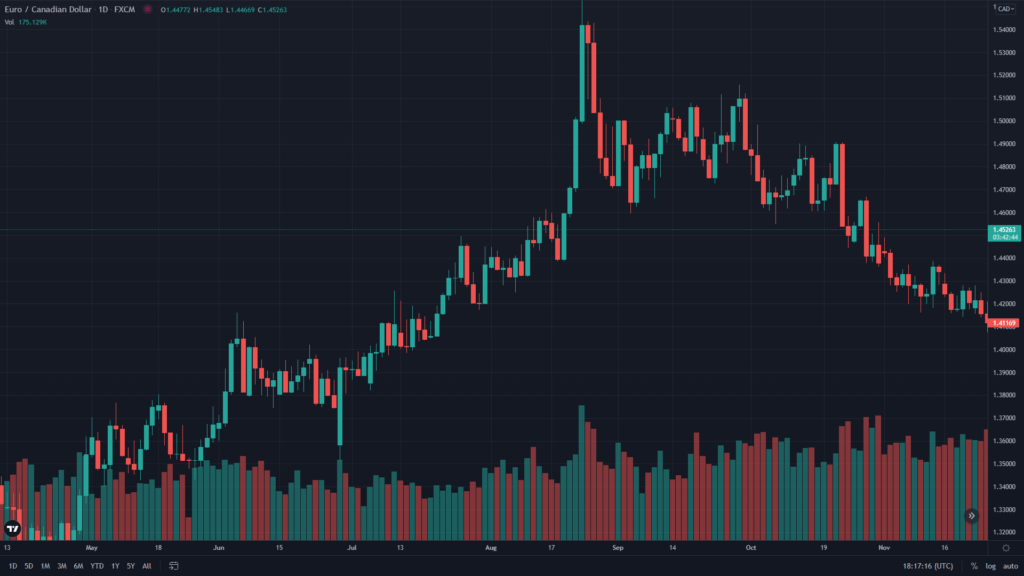
Buying Climax is the high spread bullish candlestick that closes well below its high. The candlestick has a noticeable upwards wick whose size is approximately 20% of the candlestick’s body size. It has an ultra-high or above-average high volume.
The rejection from the high along with the higher volume indicates that the market is over-supplied and the price is likely to drop in the coming sessions.
In this example we have a medium spread bullish candlestick that closed approximately 20% lower from its high. The volume bar in this session is indicating an ultra-high volume. The spread and the volume are in disagreement and suggest the market is over-supplied which is a bearish signal. You can see following the bearish signal the price significantly moved lower.
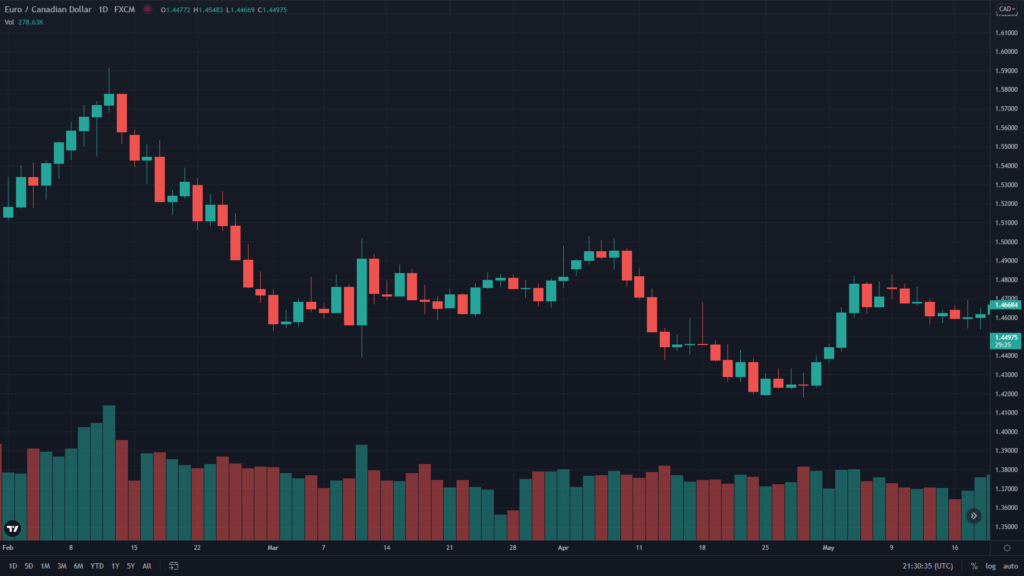
Large Bullish Spread With Low Bearish Volume
In this sign of weakness a candlestick has a large bullish spread than the previous candlestick but its volume is lower than the previous candlestick volume. The volume spread analysis suggests that there should not be any result without any effort. Here the effort refers to the volume while the result refers to the spread. So the large bullish spread is in disagreement with the low volume. It indicates an increased supply which is a bearish signal and the price is likely to drop in the coming sessions.
In this example we have a bullish candlestick whose spread is larger than the previous candlestick and its volume is lower than the volume of the previous candlestick. The volume spread analysis signifies a disagreement between the spread and price and indicates an over-supplied market which is a bearish signal. Following the signal you can see the price dropped significantly lower.
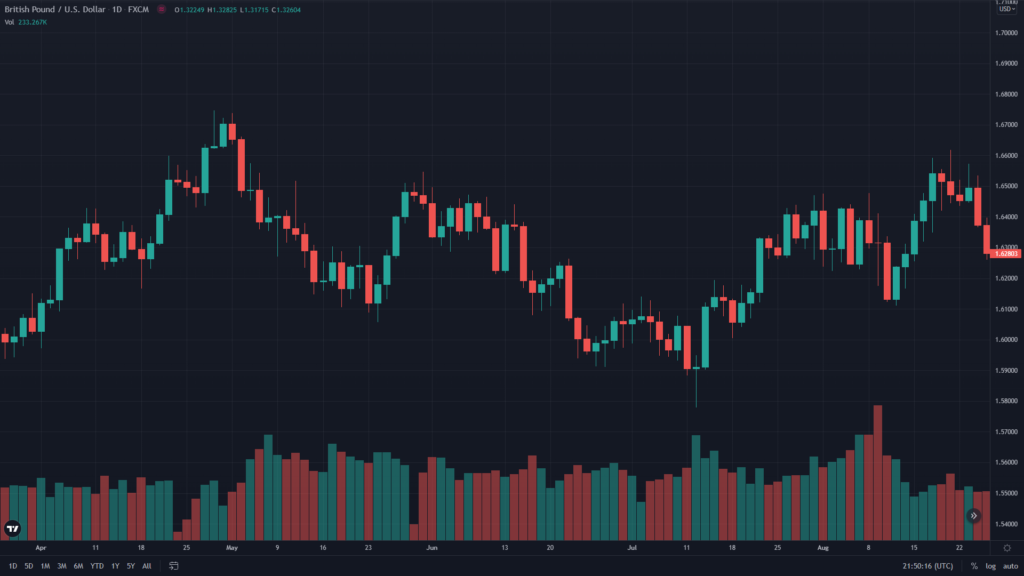
Low Bullish Spread With Higher Bearish Volume
In this sign of weakness a candlestick has a low bullish spread compared to the previous candlestick but its volume is higher than the previous candlestick volume. Based on the volume spread analysis this is a disagreement between the spread and the volume. The disagreement signifies the declining demand or the increasing supply which is a bearish signal and the market is likely to drop in the coming sessions.
In this example this candlestick is having a low bullish spread compared to the previous candlestick. But the volume of this candlestick is higher than the volume of the previous candlestick and it is a disagreement between the spread and volume. Following the disagreement you can see the rising price gradually started to fall.
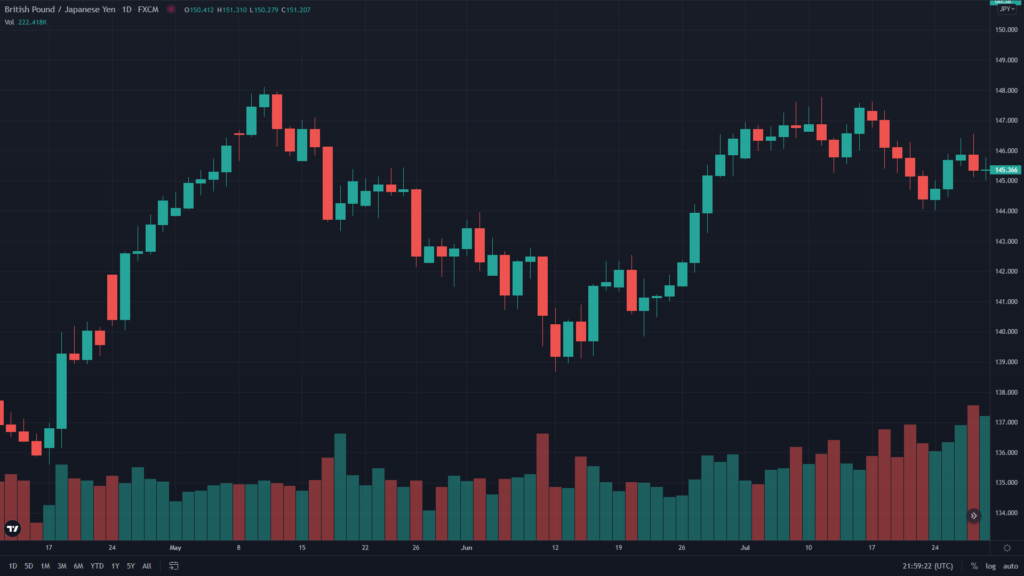
No Demand Bar
This is a low spread bullish candlestick having upward wick whose volume is lower than the previous two candlesticks volume. No Demand bar means that there is a lack of demand and supply is overpowering demand causing the price to fall in the future. Please note that No Demand is a continuation signal not a reversal signal. No Demand sign is effective when it appears in bearish momentum.
In this example we have a low spread candlestick with an upwards wick. The volume bar in this session is lower than the volume of the two previous sessions. The volume spread analysis suggests a lack of demand and since this is happening in a downtrend the No demand bar suggested the continuation of the ongoing trend and you can see the price kept dropping in the coming sessions.


