Day Trading Using ABC Strategy
ABC trading strategy is a comprehensive day trading strategy. The strategy is built around two major components that are the ABC price pattern and MACD histogram. In this video we will go over both of these components individually. You will understand the logic behind this trading strategy and learn to use it for day trading with proper entry and exit levels.
Since this strategy is for day trading that is why it is important to first learn what exactly day trading is. How effective day trading can be What exactly you can achieve from being a day trader What should be your position size How much should you risk in a day and what should be your ideal target profit on a specific day.
The RSI Indicator is around since the 1970s and it is a leading indicator which means it provides an early signal on a possible price change in the market.
What is Day Trading
Day trading is a style of short-term trading. In this style of trading a trader focuses on opening and closing the trades within the same day. A day trader capitalizes on short-term price changes to achieve the daily target. Day trading is the opposite of a long-term investment strategy. It is opposite because in a long-term trading trades are held for a longer period.
There are many advantages of day trading. Being a day trader you avoid overnight risk. The overnight risk refers to the fact that when you hold a position overnight your money is exposed to major unexpected moves. Day trading is also effective because you risk only a small portion of your investment on a particular day. In day trading you get the time to review your performance every day. In other words you get the opportunity to fix any flaws in your strategy and achieve your targets in an accomplished manner.
However to become a successful day trader you need to formulate some rules of engagement. These rules basically define the key elements like your risk position-sizing and profit targets.
As a general rule of thumb the risk should not exceed more than 1 percent of your total equity on a single day. For example if you trade with $100000 your maximum daily risk should only be $1000. The 1 percent risk is from a conservative trader’s point of view and the aggressive traders usually increase the percentage to match their risk appetite.
In day trading position sizing remains relative to your risk percentage. If you risk 1 percent and enter the trade with an oversized position your stop-loss is more likely to get hit within a small price fluctuation. In Forex trading one standard lot of a currency pair is generally considered ideal with a $100000 equity and 1 percent risk per day. Likewise In stocks and other financial markets you can figure out a reasonable position size based on your risk percentage.
Finally you also need to set your daily profit targets in day trading. A reasonable profit target should be double the size of your stop loss. For example if you risk $1000 your take profit should be $2000. Having your take profit double the size of your stop-loss keeps you in profit even if you lose 50 percent of the trades.
Now that you understand what is day trading and know about its rules of engagement let’s move on to learning the actual trading strategy.
ABC Trading Strategy
ABC trading strategy is primarily a trend following strategy. The strategy requires two confirmations to execute a trade. The first confirmation comes from the ABC price pattern. The second confirmation is taken from the MACD histogram.
The strategy is mainly used for trading in direction of the trend. However it can also be used to spot and trade the reversals. We will also discuss trading the reversal using this strategy towards the end of this video. But before that let’s first go over both the ABC price pattern and MACD histogram and learn how they work and produce the signal.
The ABC price pattern is a 3 wave pattern. Wave A tells about the direction of an ongoing trend. Wave B goes against the direction of the ongoing trend. Wave C then moves back in the direction of the trend. The ABC price pattern shows a common phenomenon in the financial market which is that the rising and falling prices temporarily move in the opposite direction before moving back in the original direction of the trend.
These small movements in the opposite direction are called the corrections. The corrections provide the traders the opportunity to enter the market at a better price while staying on the side of the trend. The whole idea of using the ABC price pattern is to find these points and enter the market at a better price.
To further understand this concept take a look at this EUR/USD chart. The RSI was keeping above the neutral zone and the pair was been steadily rising until the RSI entered the overbought zone. Soon after entering the overbought zone the pair started to move lower and dropped over 200 pips.
MACD Histogram
Now let’s also learn about the MACD histogram which is the second component in our trading strategy.
The MACD is a technical indicator. It uses three different Exponential Moving Averages for its calculation and it plots two lines along with a histogram. One of the lines is called the MACD line while the other line is called the signal line. The MACD line and the Signal line frequently crossover each other and produce a bullish or bearish signal. Traders use the signal from these lines and place their trades.
However in our strategy we will use only the MACD histogram fort the signal. The histogram shows the positive and negative bars that it plots on the middle line. The histogram shows how close or far apart the MACD and Signal lines are from crossing each other. The histogram is basically an early warning system that even signals a change before the crossover. The histogram does this by showing the positive and negative bars above or below the middle line.
Now let’s learn how to read the signal and place the trades using this strategy.
How To Read The Signal?
This first thing in the strategy is to identify a trend and spot the making of an ABC pattern. The strategy can be used for both long and short trades.
For the buy trades once an uptrend is identified you can mark that area as A from where the price started to rise. Following the rising price now look for some correction and mark that area as B from where the price starts to fall. After some correction when the price starts to move back in the original direction of uptrend mark that area as C. At this stage wave C has just started and the first signal will be confirmed when wave C crosses above the starting point of wave B.
Once that happens you need to look for the second confirmation using the MACD histogram. The signal from the MACD histogram will be confirmed only if the bars are positive and above the middle line. If the bars are negative or remain below the middle line the signal will not be confirmed despite having the ABC pattern.
When both the signals are confirmed you can place the buy trade. The stop loss for this trade will be below the starting point of wave C. The exit will be just below the previous high. For the exits you can also use the MACD histogram. The ideal way to exit using the histogram is when the bullish bars start to contract.
ABC Trading Strategy Example
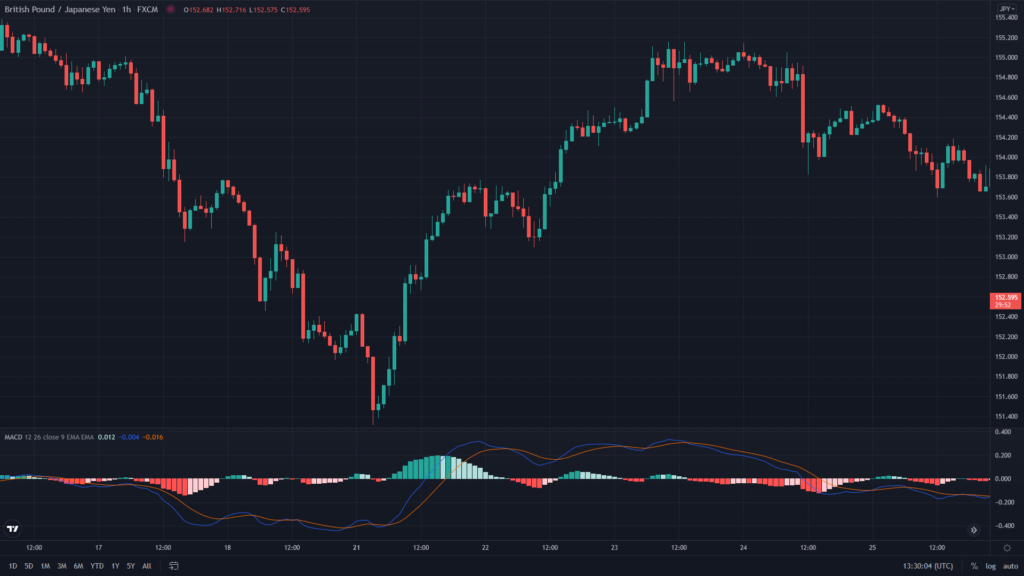
Now let’s understand the strategy using a practical example. Because the strategy is mainly for day trading this GBP/JPY chart is set on the 1 hour time frame. The pair was trending lower until at this point the price started to rise. We will mark this starting point as A .Soon after some upwards movement a small correction phase started. We will mark this area as B. After a small movement in the opposite direction the pair once again started to rise. We will mark this area as C.
The first signal is confirmed after wave C moved above the starting point of Wave B. Now a signal from the histogram is required to place the buy trade. The histogram bars remained bearish even after the first confirmation from the ABC pattern. However after a couple of sessions the histogram bars turned bullish and also moved above the middle line. This confirms the signal and you can see the pair continued to move higher.
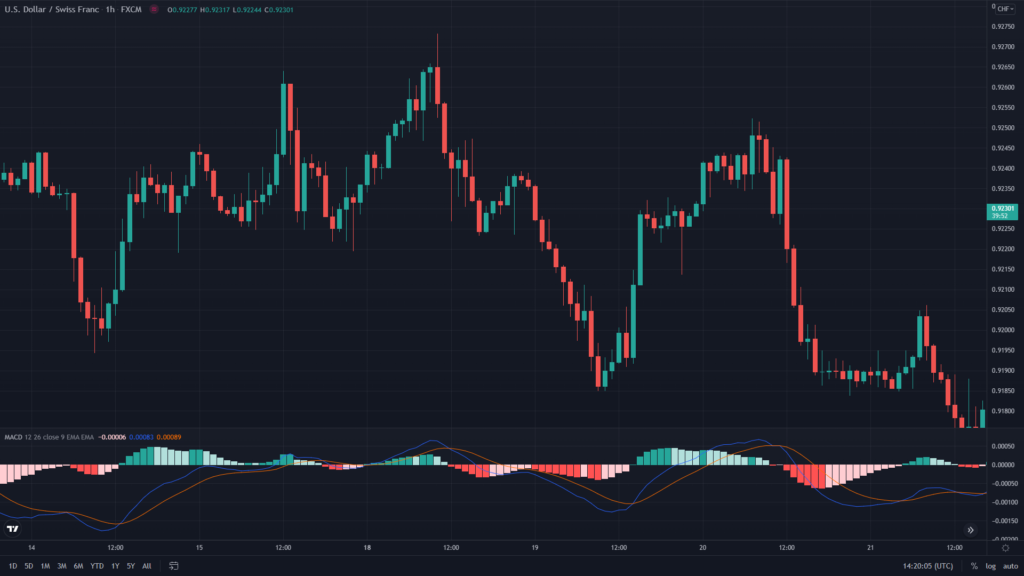
Now let’s take an example of the sell trade using the ABC trading strategy. This USD/CHF chart is set on the 1 hour time frame. The pair started to drop from this point and we will mark this area as A! .After dropping a while the price started to make some correction. We will mark the starting point of correction as B! .After a small correction the price once again started to drop and we will mark this area as C! .The signal from the ABC pattern is confirmed when the price breached blow the wave C!
Now the first signal is confirmed and a second confirmation is needed from the MACD histogram. Around the same time when wave C breached below wave B the histogram was already bearish and also kept below the middle line. This confirmed both the signals and the pair continued moving lower.
Reversal Strategy
The preferred method of using the ABC trading strategy is to trade in the direction of the trend. However it can also be used to trade the reversal. The idea is that if wave B which is the correction wave moves beyond wave a then it indicates a possible trend reversal. In such a case you can place the trades in the opposite direction of the ongoing trend.
In a bullish market if wave B moves below the starting point of wave A it signals a lower move and if the histogram bars also turn bearish you can place the sell trades.
Likewise in a downtrend, if wave B extends above the starting point of wave A it signals a higher move and if the histogram bars also turn bullish you can place the buy trades.