Relative Strength Index (RSI)
Relative Strength Index or RSI is a technical indicator that measures the market momentum by comparing it’s upwards movement with the downwards movement over a specific time period. The RSI was developed by a technical analyst named J. Welles Wilder. He described the momentum as being the velocity of the directional price movement. So according to him it’s not just whether the price is going up or down it is how fast the price moves up or down.
The RSI Indicator is around since the 1970s and it is a leading indicator which means it provides an early signal on a possible price change in the market.
Basically the RSI measures the overbought and oversold conditions. An overbought condition is when the price of an instrument trades above its fair value. Likewise an oversold condition is when the price of an instrument trades below its fair value. Both the overbought and oversold conditions have their implications. Generally when the market enters the overbought or oversold zone it soon follows a correction. Traders look for these overbought and oversold zones and place their trades accordingly.
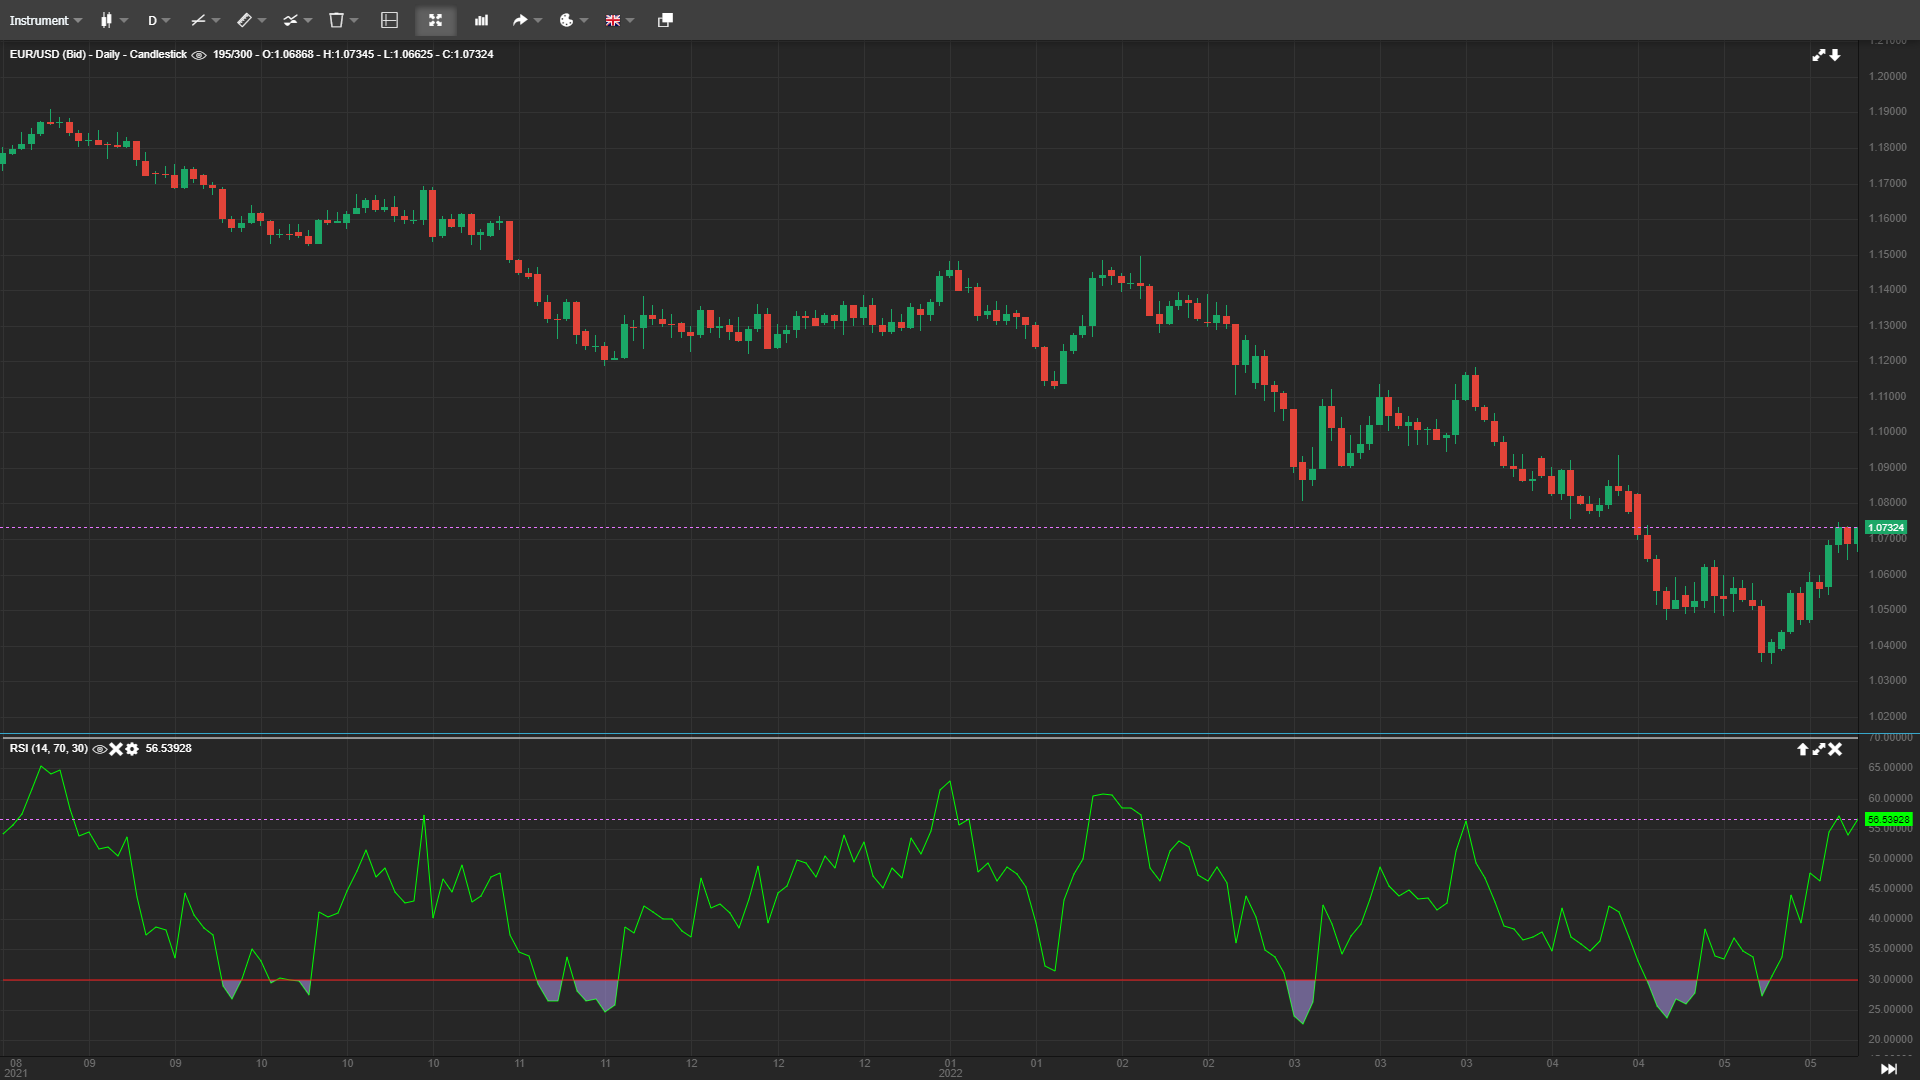
When you plot RSI on a chart it oscillates a line between 30 and 70. A reading near 50 is considered neutral. If the RSI line moves between 50 and 70 it indicates a bullish momentum. If the line moves above 70 it indicates an overbought market.
Likewise if the RSI line remains between 50 and 30 it signals a bearish momentum. Finally if it moves below 30 it indicates an oversold market.
How To Trade Using RSI?
To trade using the RSI indicator the general consensus is to trade when the market is overbought or oversold. It’s because these are the levels from where the market is likely to make a correction. So in simple words you can sell when the RSI is near or above 70. Likewise you can buy when the RSI is near or below 30.
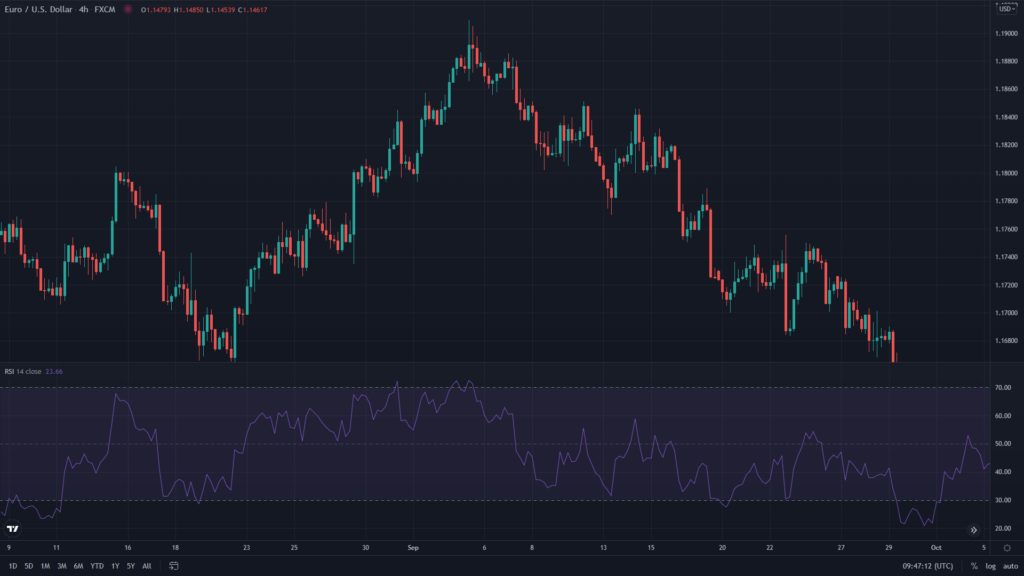
To further understand this concept take a look at this EUR/USD chart. The RSI was keeping above the neutral zone and the pair was been steadily rising until the RSI entered the overbought zone. Soon after entering the overbought zone the pair started to move lower and dropped over 200 pips.
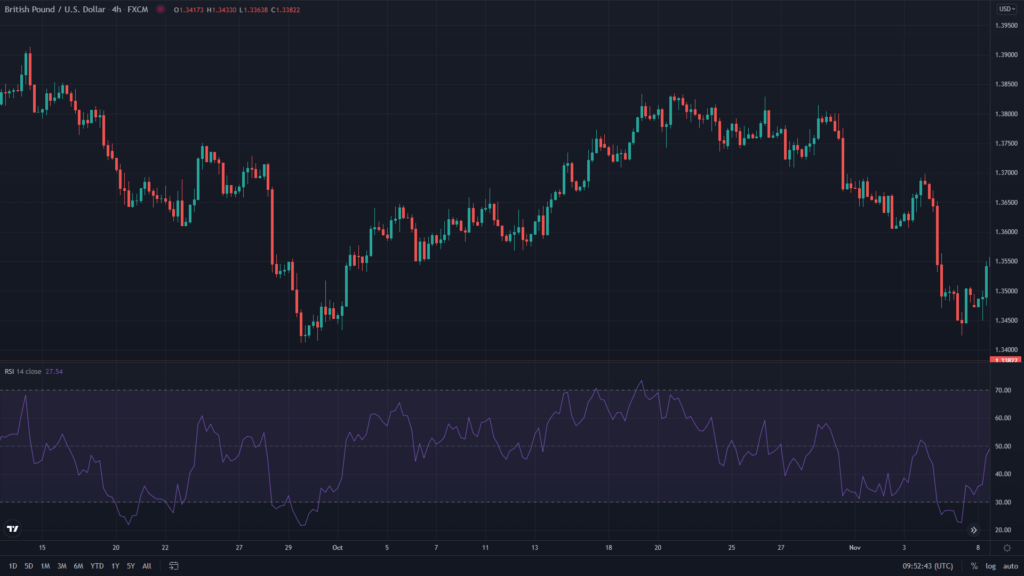
Now let’s understand the oversold concept from this GBP/USD chart. During this highlighted period the RSI largely kept below the neutral zone and the pair kept dropping from 1.3900 until the RSI entered the oversold zone. Soon after the RSI oversold indication the bulls started to intervene and the pair started to move higher.
In addition to using the RSI for overbought and oversold zones you can also use RSI to determine the exit levels. Let’s assume that you are holding a buy position. The trade is in profit but you are not sure about the exit level. In this case you can plot the RSI and if it remains in between 50 and 70 you can continue holding your long position. However you need to close your position as soon as the RSI moves above 70. Having the RSI above 70 essentially means the market is overbought and it can make some correction anytime. Therefore it is ideal to book the profit at this stage.
Likewise you can also use the RSI to determine the exit level for your sell trades. In this scenario you can continue holding the sell position until the RSI remains in between 50 and 30 and close the trade as soon as the RSI moves near or below 30. Having the RSI near 30 indicates the overbought zone and the price may recover anytime from that point. So it’s an ideal time to book the profit.
Just like any other technical indicator the RSI can also produce false signals. To minimize this risk you can use a second indicator. This can be pivot points Bollinger bands or even the moving average indicator. Majority of the traders prefer using the moving average with the RSI. The moving average provides further insight to the trend direction and it also indicates the support and resistance areas.
This brings us to the end of this lesson. As with any trading indicator it takes time and practice to gain an upper hand and there cannot be a better way than practicing on a demo account.