Scalping Stratagies
Scalping is a trading technique that involves entering and exiting from the market in a very short period of time to obtain a quick profit. This trading method has gained huge popularity in recent times. It is used on smaller time frames starting from just 1 minute. The scalping strategy is equally effective for Forex stocks commodities or any other financial market. Using this technique trader’s place high frequency trades and it requires high volatility to enter and exit in short period of time. That is why Forex is considered a more convenient market.
There are several ways you can scalp the markets. You can scalp by visually analyzing the price action and predict the price movement. You can simply rely on the candlestick Patterns or the western charting patterns to look at the price action and place the trades. You can also use technical indicators and oscillators like the moving average and the RSI. The technical indicators and oscillators can be used in isolation or you can use them together for better signals. So to wrap up scalping is a style of short-term trading and it requires high volatility to enter and exit from the market.
So what is an effective way to scalp the markets? .The right way to scalp the market is to have a high-performance scalping strategy. There are several trading strategies available. However not all strategies are high-performing strategies. In this video you will learn about multiple scalping trading strategies that are effective easy to learn and they will keep you on the right side of the market.
We will first start with a simple strategy and then move on to more advanced scalping strategy. The first strategy that you are going to learn is simple and effective. It is based on the moving average indicator.
Scalping Strategy Using 2 Moving Averages
So what exactly is our strategy? Our strategy is to use two exponential moving averages one with a 50 period and the other with a 200 period. The idea is to trade when the two moving average crossovers. The crossover produces a bearish or bullish signal and based on the crossover we will place our trades.
What is Bullish Bearish Crossover?
A bullish crossover takes place when the short-term moving average crosses the long-term moving average from below. A bullish crossover signals that the price is likely to rise and as a trader it’s generally a buy signal.
Likewise a bearish crossover takes place when the short-term moving average cross the long-term moving average from above. A bearish crossover indicates that the market is likely to drop and traders take it as a sell signal.
Now based on our moving average strategy we will use a 5 minutes candlestick chart and take a buy position when the moving averages produce a bullish crossover. Meaning when the short period moving average crosses above the longer period moving average. The stop-loss in this trade will be just below the 200 period moving average. While the take profit will be double the size of your stop loss.
Similarly we will take a sell position when the moving averages indicate a bearish crossover or in the other words the short period moving average crosses below the long period moving average. The stop-loss for this trade will be above the 50 periods moving average and the take profit will be double the size of your stop-loss.
Now let’s look at our strategy in action. Following our strategy two Exponential Moving Averages with 50 and 200 periods are applied on EURO/JPY 5 minutes chart. The 50 period E M A color is red while the 200 E M A color is blue.
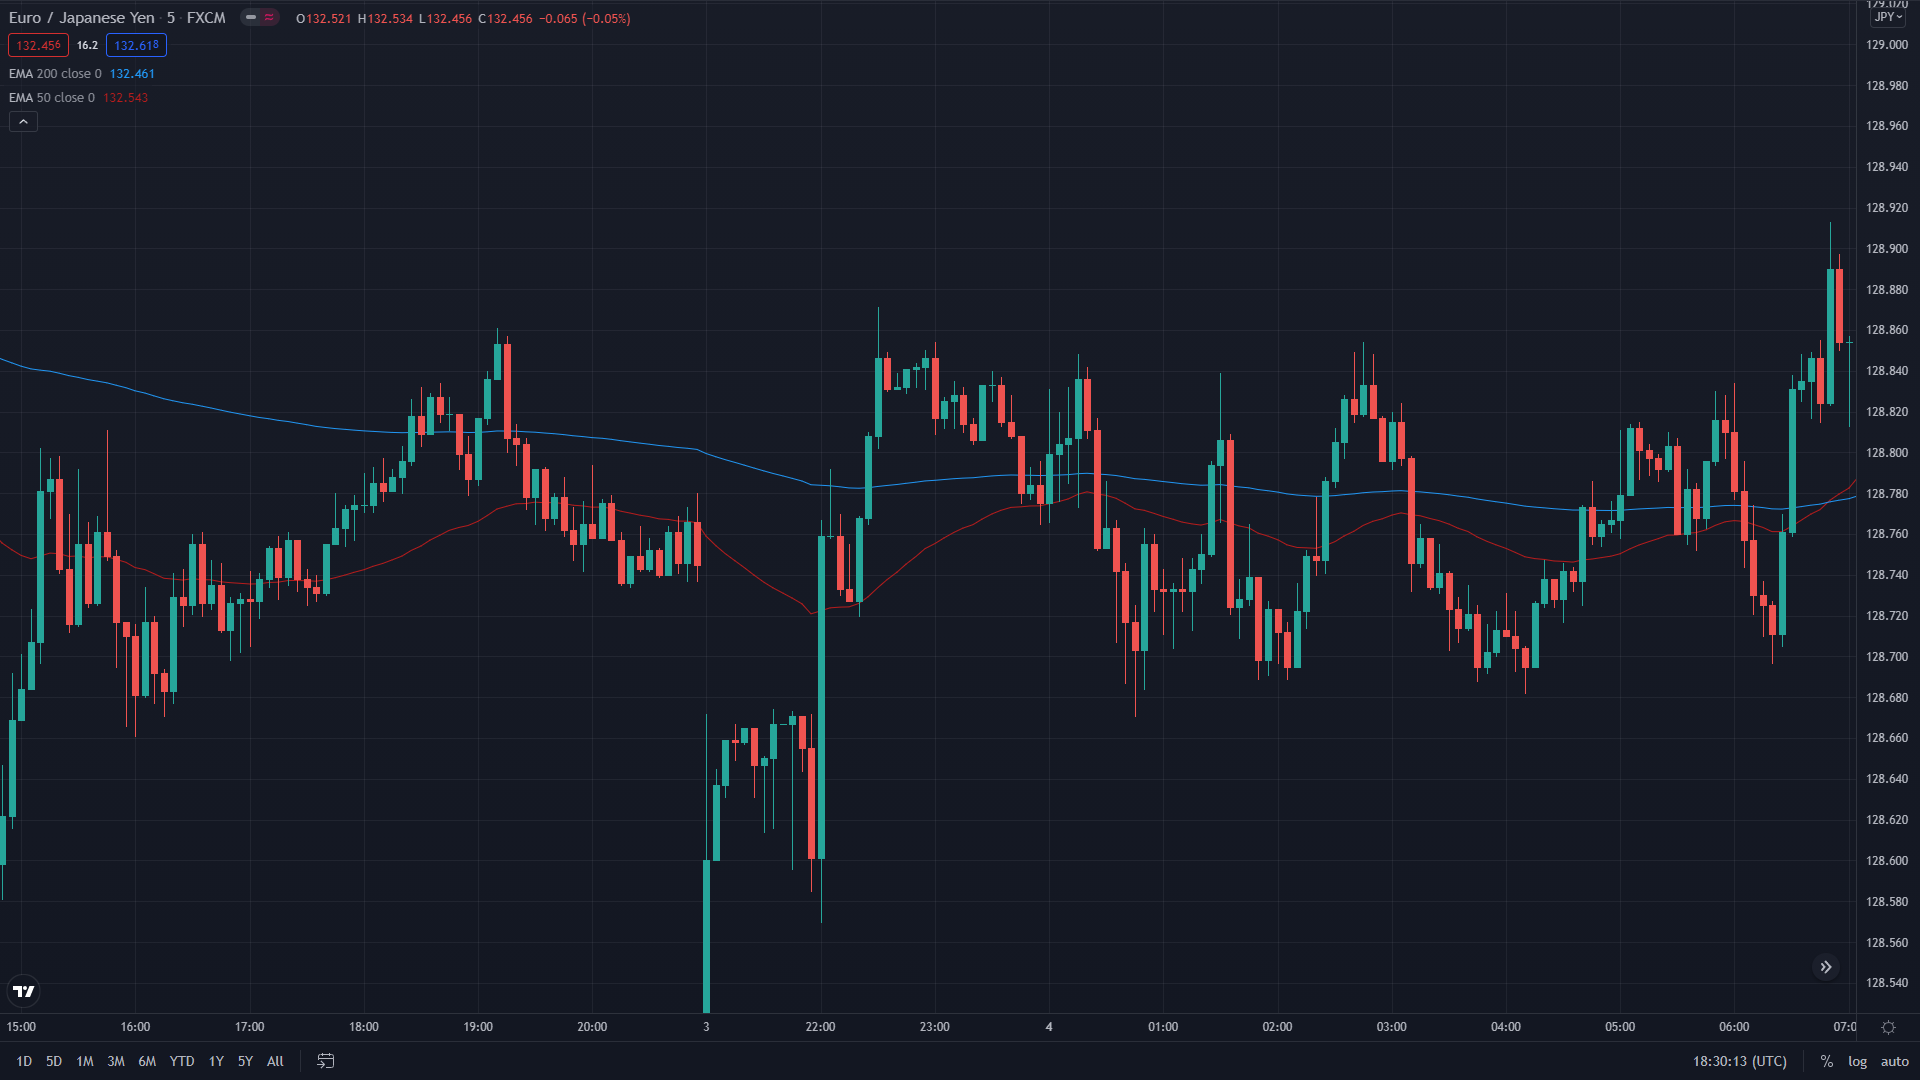
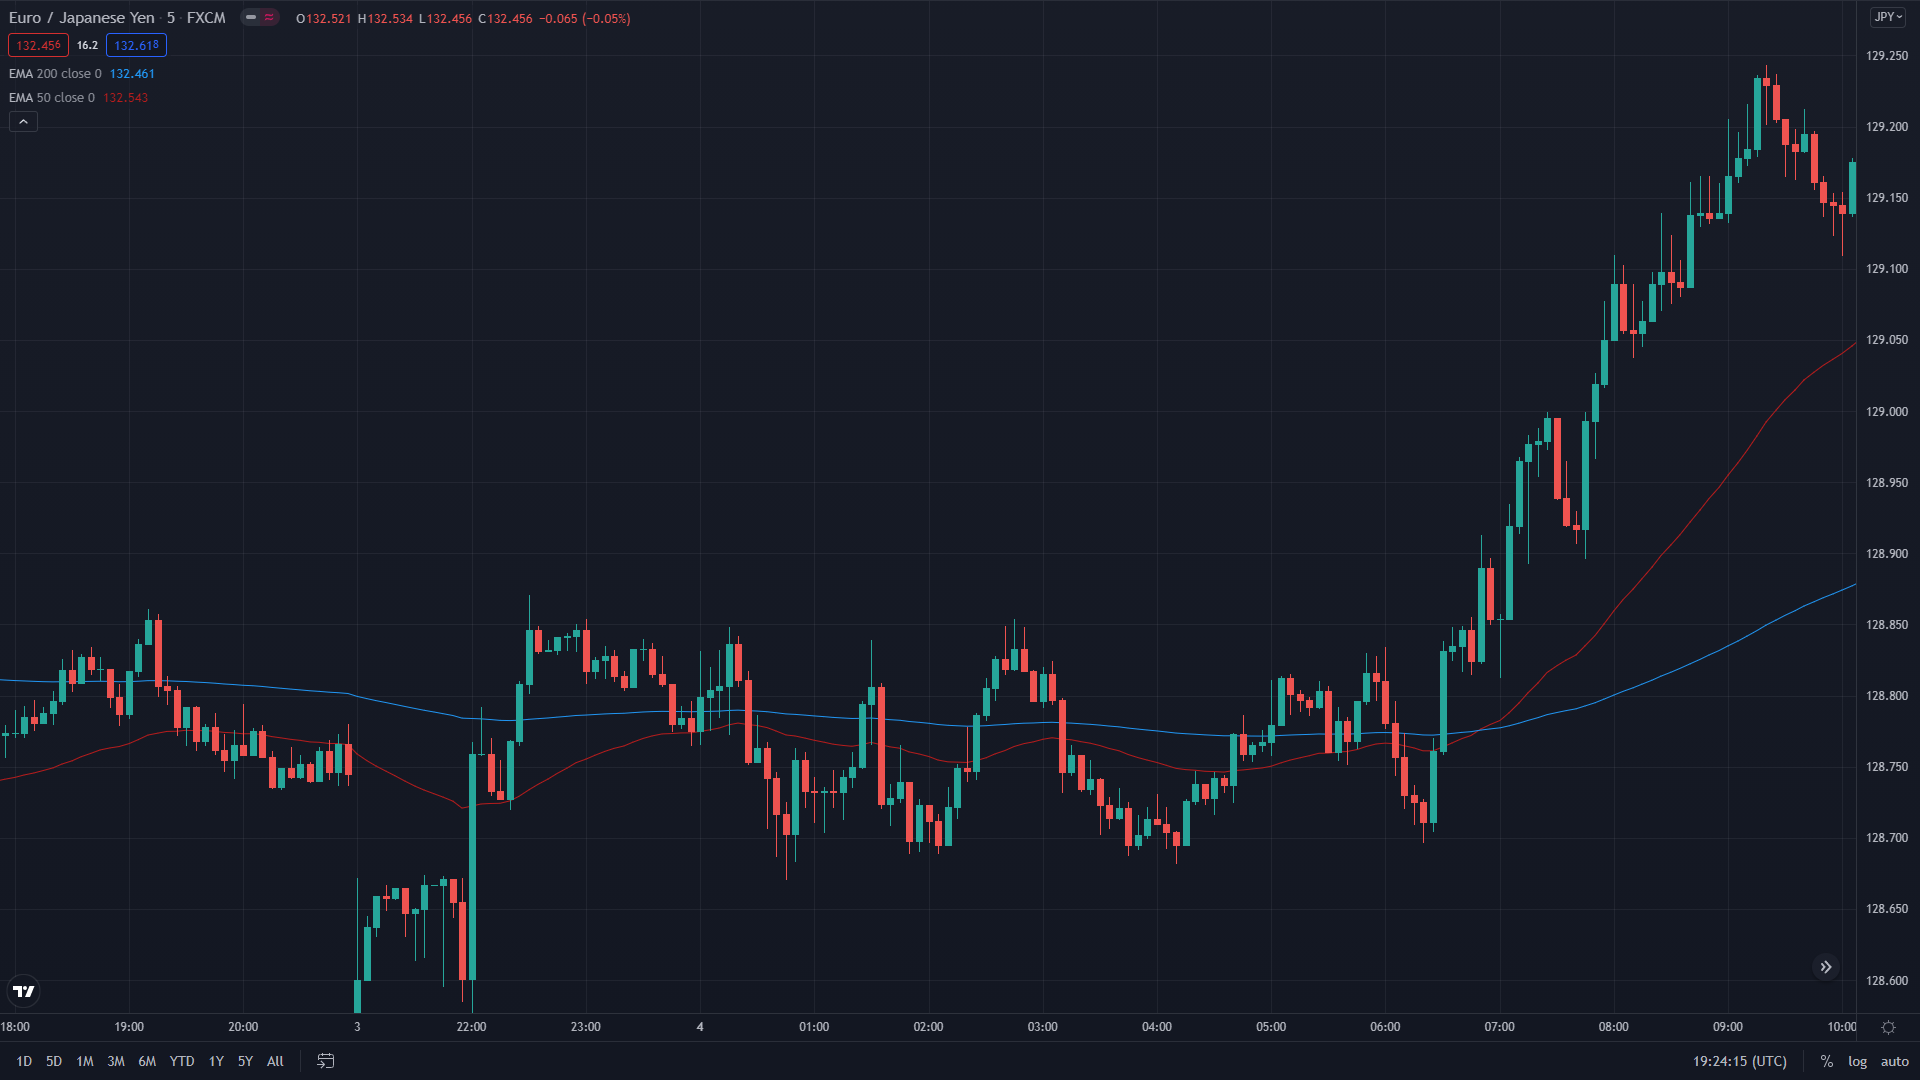
You can see that the market has been largely trading sideways. However just around 128.70 the price started to rise and around the same time the short period E M A crossed above the longer period E M A which is a bullish signal. So following the bullish signal a buy entry is placed with a stop loss just below the E M A 200. Let’s see on the next chart how the market moved?
Scalping Strategy Using Two Indicators
In our first strategy we have used two exponential moving averages and it was based on the crossover. In this strategy we will use only one Exponential moving average and with that the second technical indicator will be an oscillator which is the Relative Strength Index or RSI.
RSI is a momentum indicator. It is generally used for identifying the oversold and overbought zones. It’s available on all the trading platforms and when applied on a chart it gives a reading between zero to hundred. The 50 is a neutral zone while reading near or below 30 is considered an oversold indication. Likewise a reading near or above 70 is considered overbought.
Strategy Breakdown
Based on the two indicators strategy we will place a buy trade when the RSI is above the neutral zone and the moving average line is below the current price. Having RSI above the neutral zone indicates the market is headed upwards.
Likewise having the moving average line below the market price indicates a support area.
The stop-loss in this trade will be just below the moving average. While the take profit in this trade will be when the RSI reaches near the overbought zone.
To place a sell trade using our strategy the RSI needs to be below the neutral zone and the moving average needs to be above the current price. Having the RSI below the neutral zone indicates that the market is headed lower and having the moving average line above the current price is an indication of a resistance area. The stop-loss in this trade will be above the moving average line. The take profit will be when the RSI line reaches near the oversold zone. Now Let’s have a look at your strategy in Action.
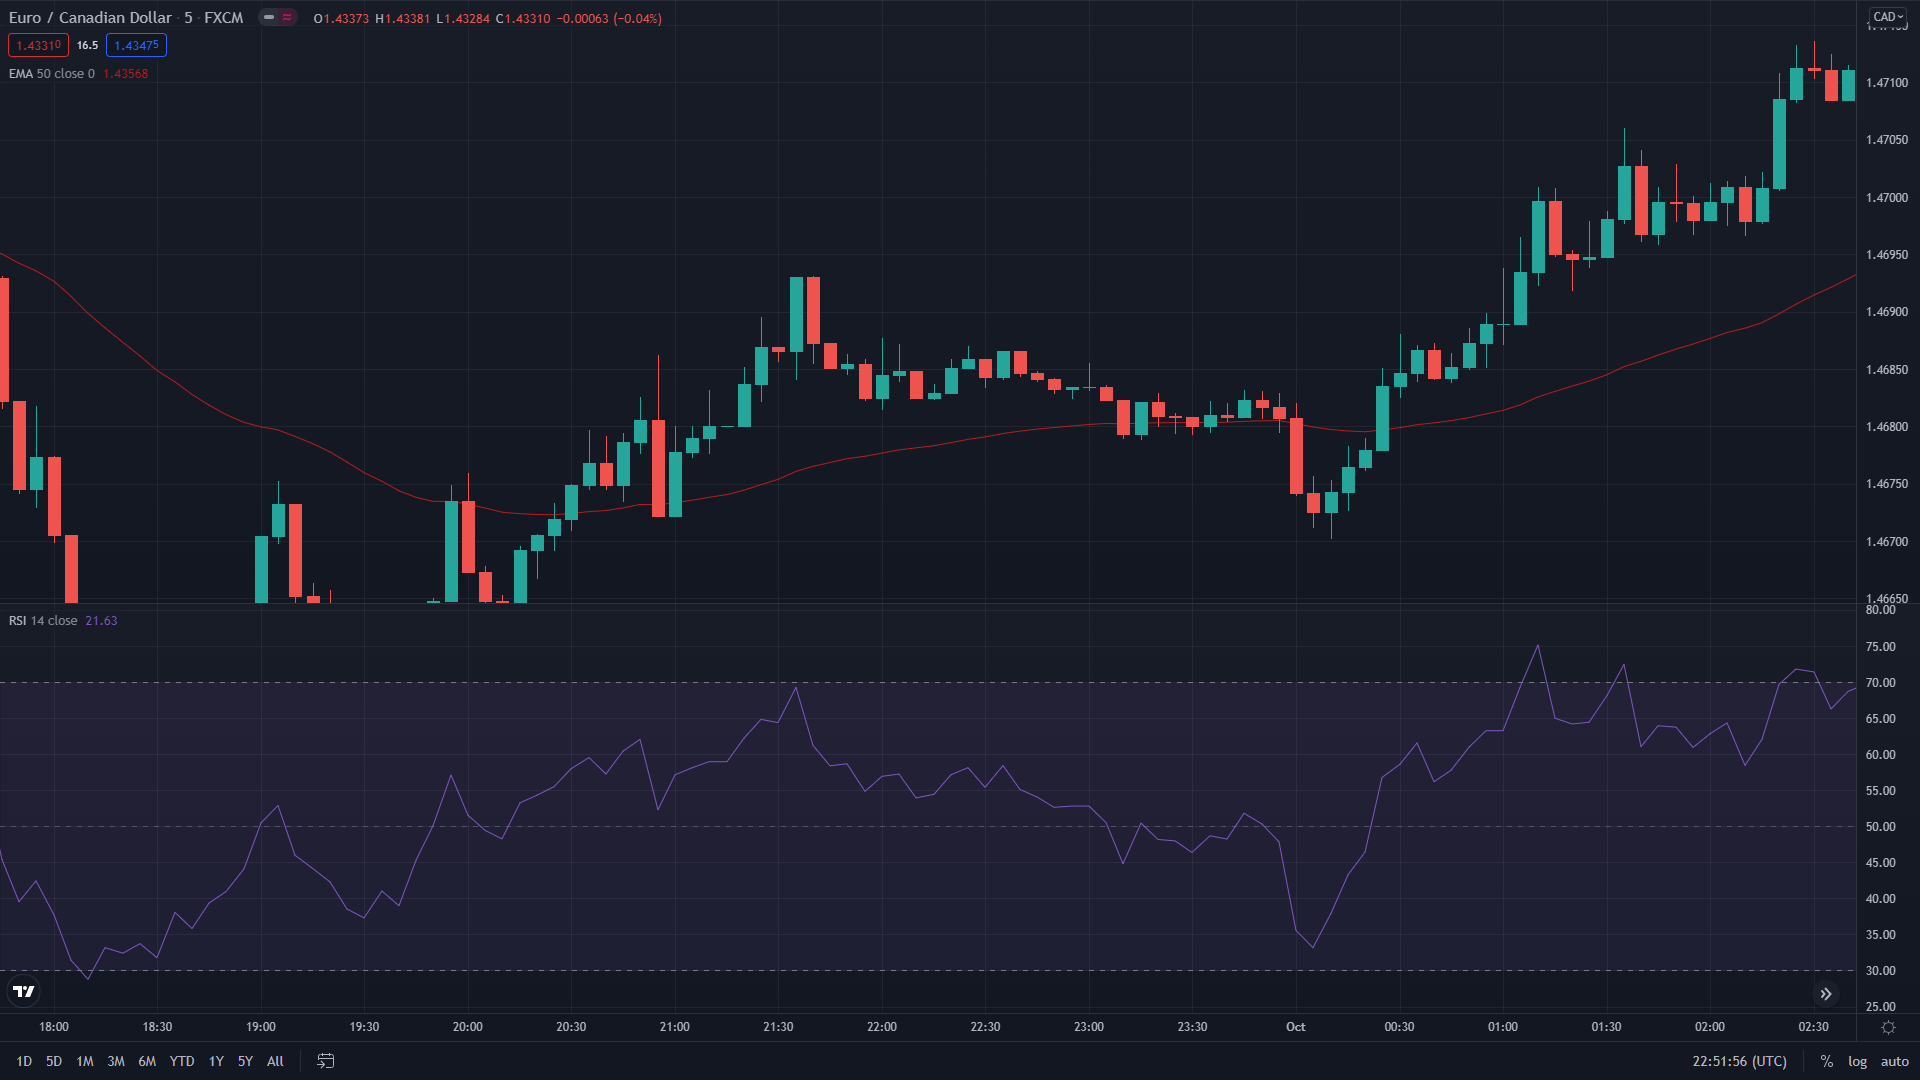
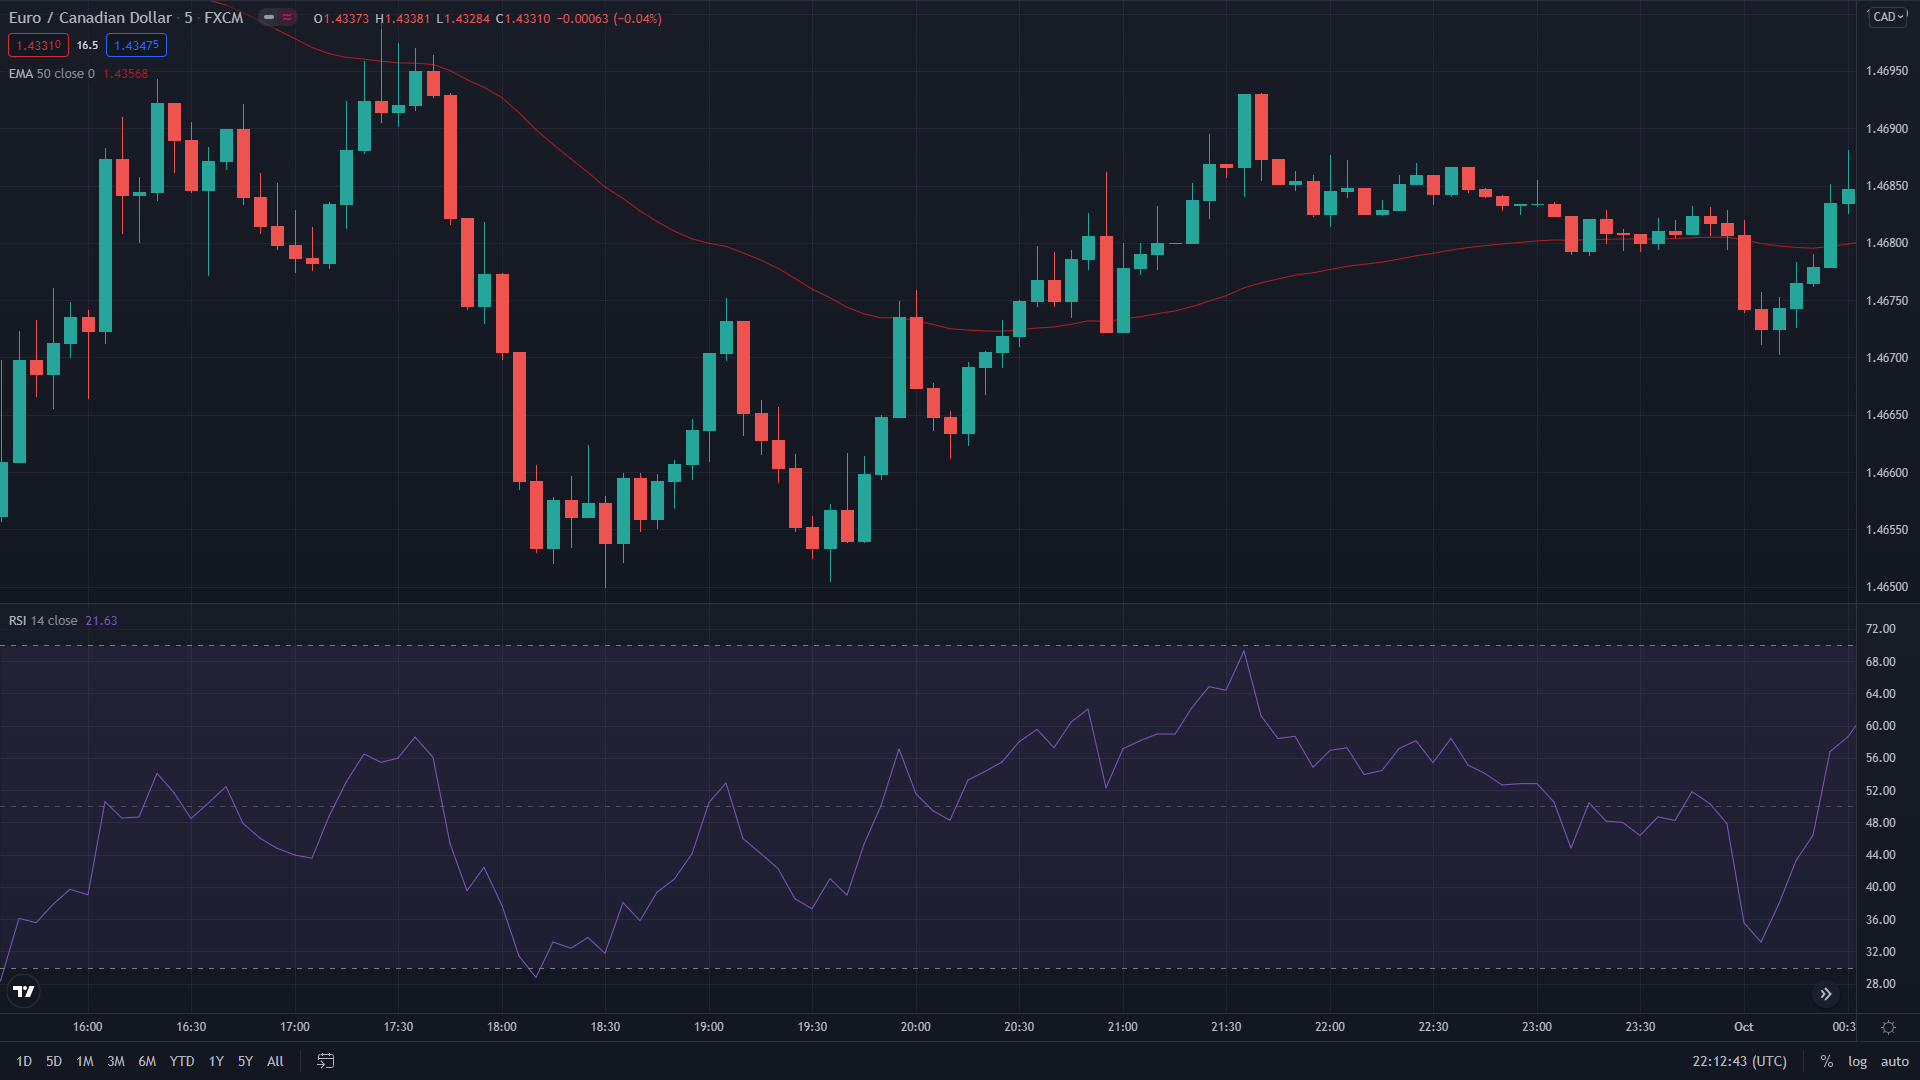
Based on our strategy a 50 period EMA and the RSI are applied on the following EUR/CAD chart which is set to five minutes interval. .You can see the pair is having two way movement and no clear direction is available. However near 1.4680 the RSI moved above the neutral zone. Around the same time the price that was keeping below the EMA also moved above the E M A line. Following our strategy this is a bullish signal. So a buy trade is placed at 1.4680. The stop-loss is kept below the EMA around 1.4665. Now let’s see what happened after our strategy gave a bullish signal and we placed a buy trade.
Now from the next chart you can see the performance of our strategy. Soon after taking the buy trade, the pair moved higher towards 1.4700. You can also see around this level the RSI entered the overbought zone. And based on our strategy we can close our position here in 20 pips profit. Alternatively to benefit from the entire rally you can also use a trailing stop loss.