Pivot Points Indicator
Pivot points is a technical indicator used for analyzing the support and resistance areas. The indicator uses very simple price information for its calculation. It takes the previous high low and closing numbers to construct a central pivot line. It then plots the support and resistance lines above and below the pivot. The number of support and resistance lines vary based on the trading platform and indicator settings. However most of the trading platforms plot two lines above the pivot and two lines below the pivot. The two lower lines are the support lines and are identified as s1 and s2. The two lines above the pivot are the resistance lines and are identified as r1 and r2.
The pivot line is the central value and is used as a reference point for future price movements. In the two support lines the S2 is considered a stronger support than the S1. Similarly the R2 is considered a stronger resistance than the R1.
Pivot points were originally used by floor traders on stock exchanges. They used the high low and closing prices of the previous day to calculate pivot points for the current trading day. This calculation helped them notice important levels throughout the trading day. Pivot points indicator has predictive qualities. It is considered a leading indicators to the traders.
The central pivot is the most important price level for the day. Essentially it represents the balance between bullish and bearish forces. In other words when prices are above the central pivot the market is considered bullish. If prices fall below the central point the market is considered bearish. While pivot points were originally used by floor traders they’re now also used in Forex and other market.
How Pivot Points Aare Calculated?
Today’s modern trading platforms automatically calculates the pivot points for you. However knowing how the calculation is done will give you more confidence to use the indicator.
The pivot points are calculated using several methods. However we will go over the most commonly used method. The central pivot is calculated by adding the high low and close of the previous period and then the sum is divided by 3.
The support one or S1 is calculated by multiplying the pivot value with two and then the market high is subtracted from the total.
The R1 is calculated by multiplying the pivot value with 2 and then the low is subtracted from the total.
The S2 is calculated in two steps first by subtracting high and the low and then the total is subtracted from the pivot value.
Finally the R2 is also calculated in two steps first by subtracting the high from the low and then the total is added to the pivot value.
How To Trade Using Pivot Points?
Pivot Points is a versatile indicator. It can be used not only for entry and exit levels but also for breakout trading. When you plot the pivot points on a chart and the price remains in between the central pivot and the R1 It indicates the price is in the positive zone and it can rise further. In this setup usually a buy trade is taken. The take profit remains just below the R2 while the stop-loss remains below the central pivot. For a safer trade the stop loss can also be placed below the s1.
Likewise when the price remains in between the central pivot and the S1 it indicates the price is in the negative zone and it may drop further. In this case traders prefer placing sell trades. The take profit for this trade remains just above the S2 while the stop loss remains near or above the central pivot. Once again the take profit and stop-loss can be extended based on the overall momentum of the market.
There are several other ways of trading using the pivot indicator. One of that is to trade when the price reaches near the R2 or the S2. These are the two extreme points on a particular day. The R2 acts as a strong resistance area and the price generally makes some correction from this area. Similarly the S2 acts as a strong support area and the price generally moves higher from this level.
So a sell trade can be placed when the price reaches near the R2. The stop-loss for this trade remains above the R2 and take profit remains near or below the R1.
Using the same method a buy trade can be placed near the s2. The stop-loss for the buy trade remains below the s2 and the take profit remains near or above the s1.
Once again the targets can be extended based on the indications from other sources. The pivot points can also be used for the breakout trading. For example if the price breaks above the R2 it signals that the price has breached above a key resistance level and it is likely to rise further. So a buy trade can be placed on a breakout above the R2. The target for this trade can be determined by looking at the next resistance area or with the help of another indicator. The stop loss can be placed near or slightly below the R1.
Similarly a breakout below the S2 suggests a further decline because a key support level is breached. In this situation a sell trade can be taken by keeping the stop-loss above the s1. The take profit can be determined by looking at the price action or by using another technical indicator.
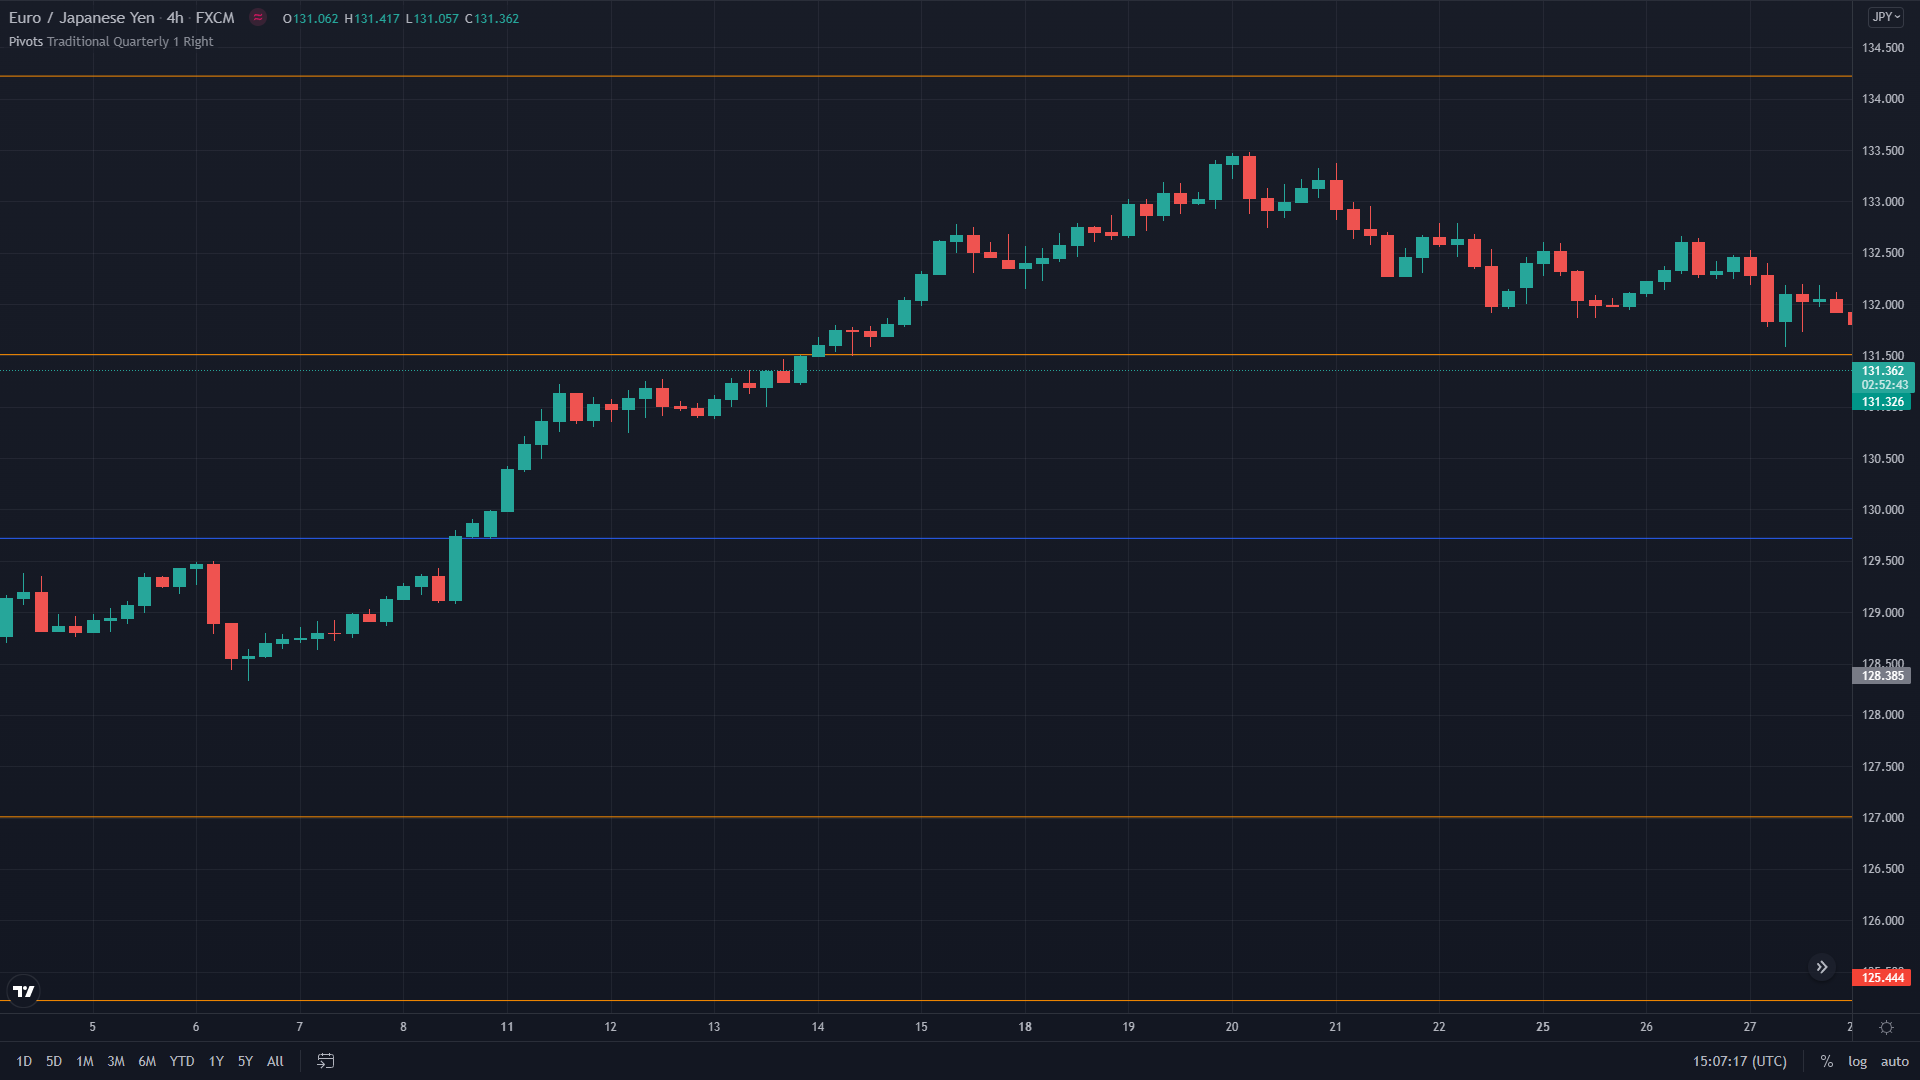
To understand further let’s take an example from this EUR/JPY chart on which the pivot points indicator is plotted. The blue line in the middle is the central pivot while the two upper and two lower lines are the support and resistance lines. The pair was trading lower until it moved above the central pivot. This led to multiple sessions closing in the positive zone and the bullish momentum continued well above the R1. However the price remained contained within the R1 and R2 for several sessions. Then after several sessions the pair once again started to move lower. This is a classical example of how the prices move between the pivot points. Hopefully you now have a fair knowledge about the Pivot Point indicator and its usefulness for trading.
As with any trading indicator it takes time and practice to gain an upper hand on the market. For this reason there is no better way than to practice Pivot Points on a demo account.
Hopefully you now have a fair knowledge about the Pivot Point indictor and its usefulness for trading.