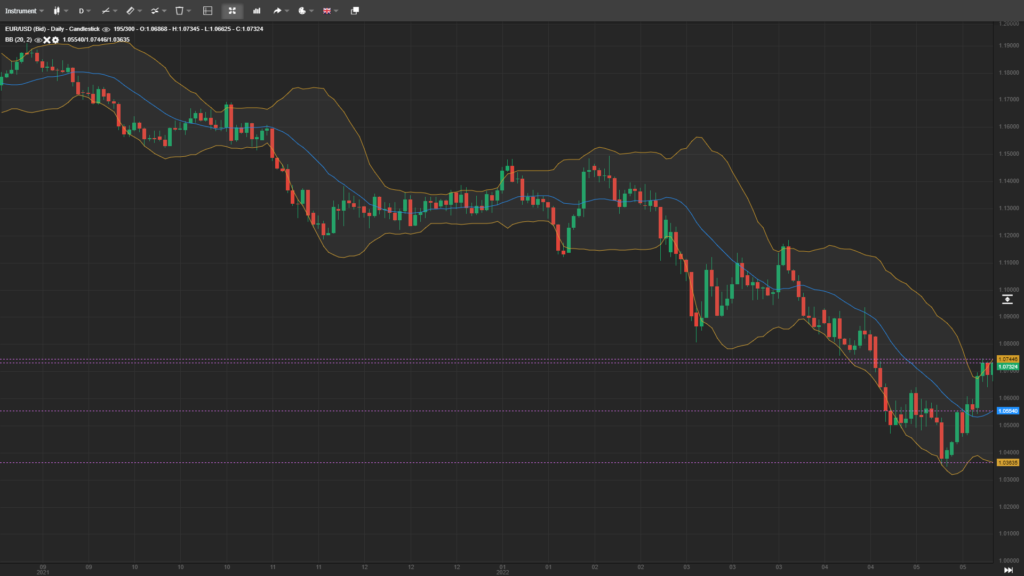
Bollinger Bands
Bollinger Bands is a technical analysis tool created by John Bollinger in the early 1980s. The indicator is used to analyze the volatility range of the financial markets. Bollinger Bands are a type of price envelope that are plotted above and below a moving average line. The moving average line is called the mid-band while two other lines are called the upper band and lower band. By default the upper and lower bands represent a two standard deviation. The default setting for the mid band or the moving average line is 20 periods.
The bands represent the volatility channel in which the price is likely to move. The standard deviation is the statistical measure that these bands use to establish the levels of support and resistance. The standard deviation is the single most important component in Bollinger bands. So before going into further details let’s first go over the standard deviation and find out its role in Bollinger bands.
What is Standard Deviation?
Standard deviation is a mathematical formula that measures volatility showing how the price can vary from its true value. By measuring price volatility Bollinger Bands adjust themselves to market conditions. This is what makes them so handy for traders. They can find almost all of the price data in between two bands.
You can plot Bollinger bands with 1 2 and 3 standard deviations. If the standard deviation is set to 1 nearly 65% of the price action will take place within the Bollinger bands. If the standard deviation is set to 2 around 95% of the price action will be contained within the bands. And if it is set to 3 standard deviations nearly 99% of the price action will take place within the bands.
Plotting the Bollinger band with 1 standard deviation produces more false signals compared to 2 and 3 standard deviations. The 3 standard deviation filters out the majority of the noise however it also produces fewer trading signals. Majority of the Forex traders prefer using 2 standard deviations.
What Information Bollinger Bands Provide?
Bollinger bands expand or contract based on the market volatility and provide useful information on market direction. The bands contract when the volatility is low and expand when the volatility is high. In other words the width of the band correlates to the market volatility and by analyzing the bands you can determine the market volatility.
The upper band indicates the highest possible level that the market can reach. Likewise the lower band indicates the lowest point market can possibly touch. From a technical point of view trading near these bands provides some sort of confidence that the market is near a support or resistance level. The general rule of thumb is that when the price is near the upper band it is overbought and when it is near the lower band it is oversold. This simple concept alone constitutes many trading strategies in addition to several other complicated Bollinger band strategies.
How To Trade Using Bollinger Bands?
One of the simplest method to trade using Bollinger bands is to see whether the price is above or below the mid-Bollinger band. If the price is above the mid-Bollinger band you can preferably take a long position. You keep the take profit near the upper band and the stop loss between the mid and lower band. Likewise if the price is below the mid-band you can prepare to take a sell entry and keep your take profit near the lower band. The stop loss in this scenario will be in between the mid band and upper band.
Another trading method which is widely used method is when the price reaches the upper or the lower the lower Bollinger band. For instance if the price is near the upper Bollinger band it is likely the indication of an overbought market therefore you can prepare to take a sell entry at that time. Your take profit would be either at the mid-band or near the lower band. The stop-loss for this trade will be just above the upper band.
Similarly if the price drops to the lower band it is the indication of an oversold market and you can plan to place long trades. The take profit will be above the mid-band. Finally the stop loss for this trade will be below the lower band.
Bollinger band is a versatile indicator and is equally useful for a breakout strategy. A breakout takes place when the market moves outside a defined support or resistance area. So the breakout trading method using Bollinger bands will be to buy when the price breaks above the upper band and conversely sell when it breaks below the lower band. The stop-loss in the breakout trading strategy typically remains near the mid-Bollinger band. To determine the exit level you can also use other indications.
These are the simplest trading methods you can adopt to trade using Bollinger Bands indicator. However these methods simply rely on a single technical tool and may not always produce best results. To add more value to the analysis you can combine other technical indicators with Bollinger bands.
Squeeze Strategy
The squeeze strategy is a useful Bollinger bands trading strategy. The strategy comes into play when the trading range gets narrow and with that, the Bollinger bands also shrink. The squeeze is an indication of a narrow trading range however it also indicates upcoming high volatility.
So the first thing in this strategy is to identify the squeeze. Identifying a squeeze is very easy as you can clearly see when the distance between the upper and lower bands narrows. The second thing to look at is how long the price consolidates in the narrow range. The longer the price consolidates the bigger the upcoming movement will be.
Once you identify the squeeze and have checked the duration of the consolidation phase you need to pay attention to the price pattern. The candlesticks provide valuable information on the price action. If you are having higher highs the price is likely to move towards the upper band and you should prepare for buy trades.
On the flip side if the candlesticks show higher lowers the price is likely to move towards the lower band and you should prepare for the sell trades.
This brings us to the end of this lesson. Hopefully, you can now use the Bollinger bands to analyze the market volatility and use this indicator to your advantage.