Moving Average Indicator
Moving average is a famous technical indicator used for analyzing the financial markets. The price of a financial instrument continuously moves up and down. The traders analyze this price fluctuation to predict the future price movement. However the rapid price change also increases the possibility of a false signal to the traders. The moving average indicator comes in really handy in this scenario. It filters out the noise and provides an insight to the price changes.
Moving average indicator does that by calculating the average price over a specific period of time. It can be any period the trader chooses. Calculation for a simple moving average is done by adding up all the data points during a specific period and dividing the sum by the number of time periods. The reason it is called a moving average is because the average is constantly recalculated based on the latest price data.
In technical analysis there are several advantages of using a moving average. The first and foremost advantage is that it simply filters out the noise created by random price fluctuations. This helps traders to analyze the price movement from a different perspective and make better decisions.
Another advantage is that it can be used on any time frame. Meaning it is equally useful for long term and short term traders. It indicates the potential support and resistance areas and also informs the traders about the trend direction. With all these advantages there are several trading strategies that can be adopted using just the moving average indicator. The moving average is not only a useful enough indicator on its own but it also forms the basis of other technical indicators such as macd. So understanding and learning the moving average indicator will also help you to use several other technical indicators.
It’s also worth knowing that the moving average is a lagging indicator and is based on past prices. Therefore it does not provide an advance indication and only confirms a signal after a price shift.
Types Of Moving Averages?
Fibonacci retracement levels can be drawn in both up trending and down trending markets and drawing the levels is fairly simple. The first step to draw the retracement levels using a trading platform is to identify a trend. Once the trend is identified you need to spot a swing low and a swing high within that trend. Then using the Fibonacci retracement tool you can draw the retracement by connecting those two swing points. [Generally you will get 5 to 6 retracement levels. However the most widely used levels are 38.2 percent 50 percent and 61.8 percent.
It is important to draw the Fibonacci retracement levels correctly. To draw the retracement in an uptrend the line is drawn from the swing low to the swing high. Likewise to draw the retracement in a downtrend the line is drawn from the swing high to the swing low.
How To Trade Using Fibonacci?
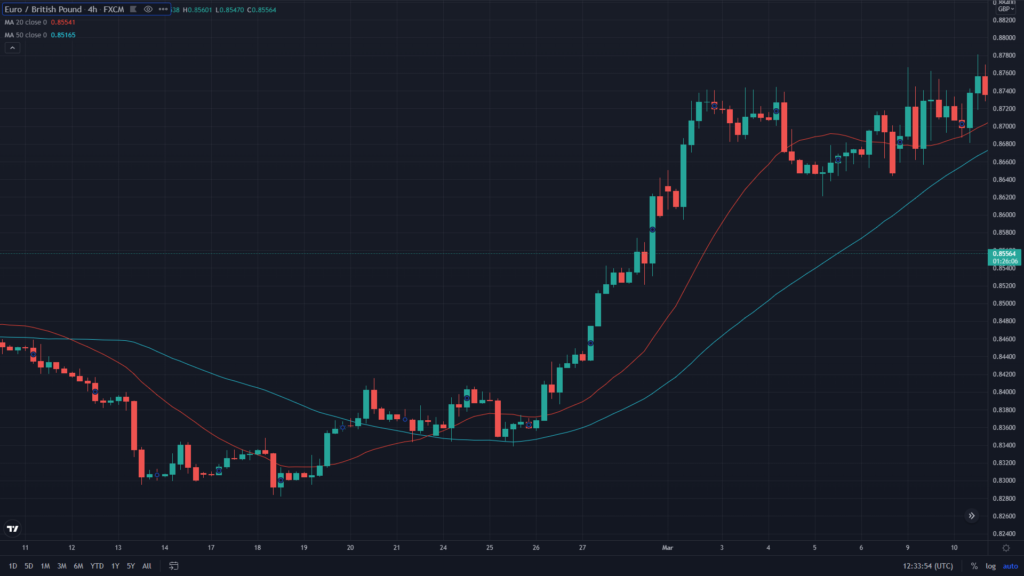
There are mainly three types of moving averages. The simple moving average weighted moving average and exponential moving average. The difference between these moving averages is the sensitivity they show to the price fluctuations.
The simple moving average gives equal weight to the entire price range in a particular period. While the weighted and exponential moving averages give more weight to the recent price action. This makes them more sensitive to the recent price action and it produces more signals compared to the simple moving average.
All three types have their advantages and disadvantages. The biggest disadvantage of the simple moving average is that it produces fewer signals compared to the other two types. However the weighted and exponential moving averages may produce more false signals compared to the simple moving average.
One way to overcome these issues is by plotting two different moving averages on a chart. This way traders can analyze signals from both the moving averages and have more market information to make a decision.
To trade using the retracement levels in a downtrend the ideal entry level is once again between the 38.2 percent and 50 percent retracement levels. The stop-loss for this trade will be above 61.8 retracement level. For the take profits you can rely on the price action or also use another indication.
There are many theories as to how one can trade using retracement levels. However it is widely accepted among traders that the majority of the retracement completes near the 50 percent level and if the price goes beyond the 61.8% level the trend is considered to have changed permanently.
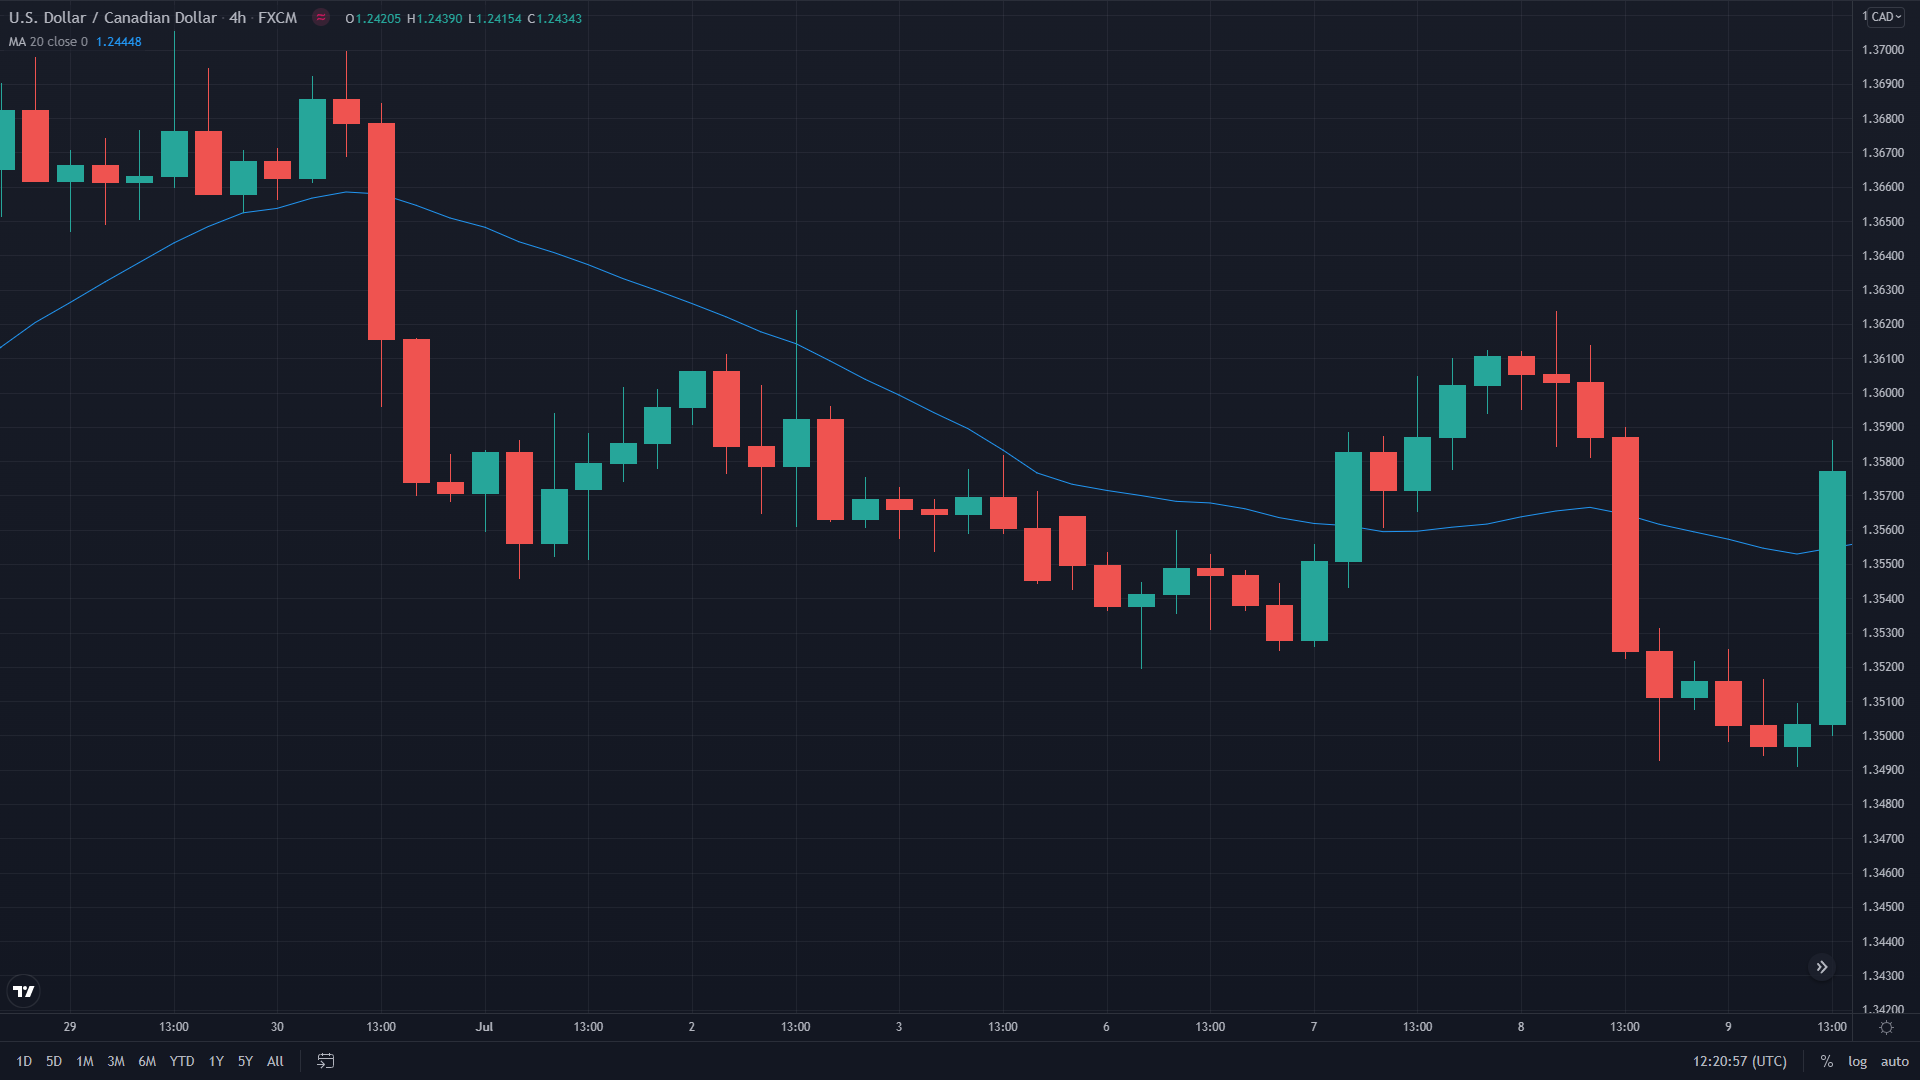
The Following EUR/CAD chart is an excellent example of how the retracement levels work. On this chart the Fibonacci retracement is drawn using the two swing points. Once the pair starts to move lower from the swing high it gets some support around the 38.2 percent retracement level. The price largely remains above the 61.8 percent retracement level. And then after a few sessions, the price starts to recover and moves higher than the first swing high.
Moving Average Timeframe
To analyze the market using the moving average you have to decide on a timeframe. The timeframe largely depends on your trading approach. For example if you are a long term trader you need to select a longer timeframe and if you are a short term trader then a smaller timeframe may also work for you. Remember a bigger timeframe gives you a better sense of the market.
Even if you are a short term trader it’s always a good idea to start on a bigger timeframe and scale it down. This will help you understand the overall picture of the market. Other than the timeframe you also have to decide on the type of moving average to use? For short term traders exponential moving average generally works well because it emphasizes more on the recent price action. For long term traders the simple moving average is a better choice as it clears out the sudden price fluctuations in a better way.