Free Forex Trading COURSE

Free Forex Education

Types of Trends

The price movement of a financial instrument in an identifiable direction is called a trend. Trend identification is the most basic function of technical analysis.  A trend offers the opportunity to trade in its direction which enables a trader to capture a large movement.

Generally, trade in the direction of the trend is considered safer. Therefore the first step in trend analysis is to identify its direction. The simplest way to identify a trend direction is by looking at the chart. An uptrend would typically have higher highs while a downtrend would have lower lows.

Remember that the price does not moving up or down in a straight line therefore you would also see small corrections even in a trending market. When you spot the trend direction those corrections provide the opportunity to trade at a better price.

Uptrend

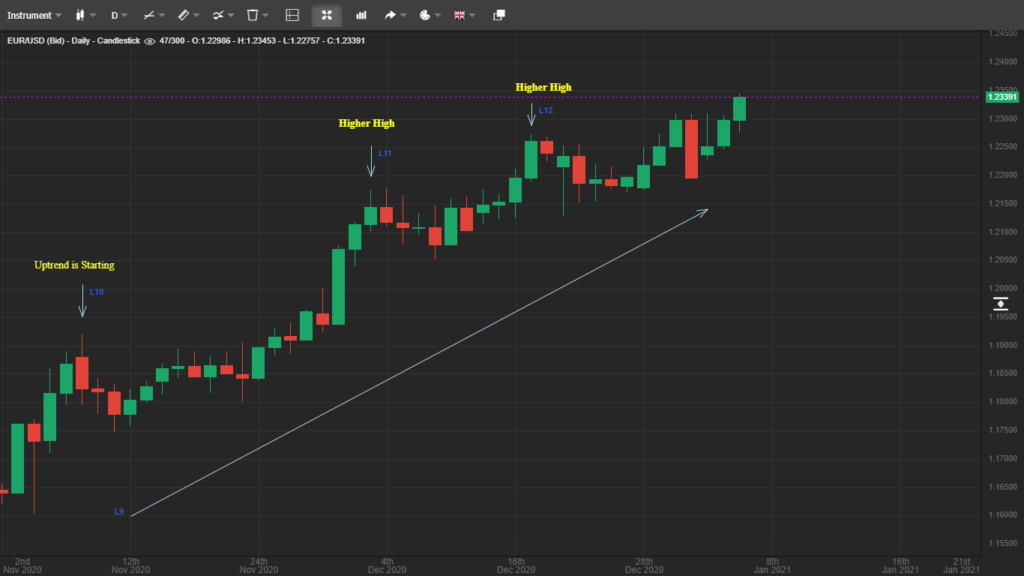
Take a look at the EUR/USD chart in which you can see that the EUR/USD is an uptrend. You can see that the pair is making higher highs which indicate the direction as well the trend momentum.

Down Trend

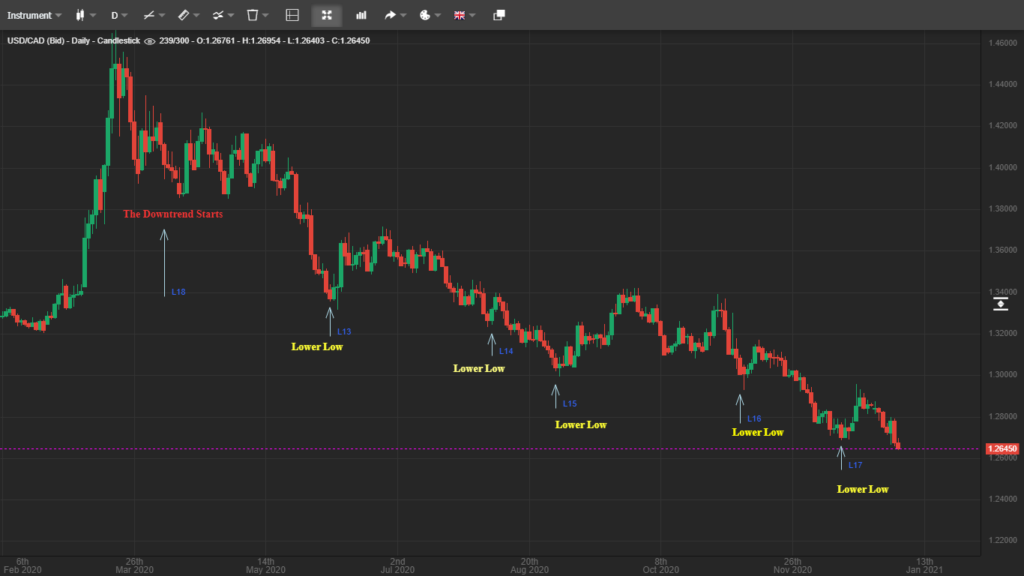
To understand a downtrend take a look at the below USD/CAD chart. You can see a downwards trend started near 1.4600 and ever since the pair is making lower lows which is an indication of an ongoing downwards trend. The lower lows are also indicating the momentum of the trend.

Sideways Trend

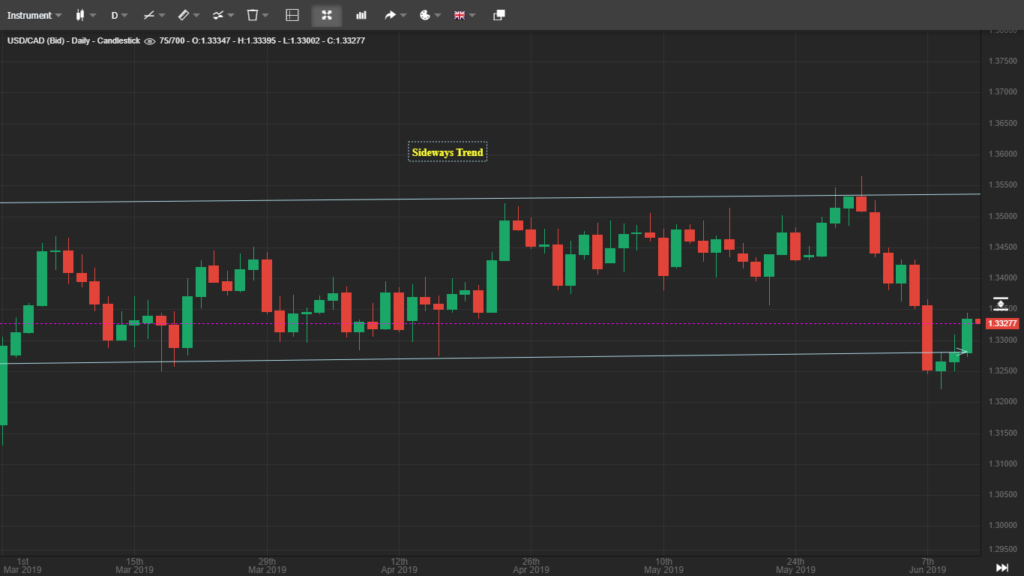
Now also take a look at the below USD/CAD which is showing a sideways trend. The price in a sideways channel generally remains contained. The sideways trends are often followed by a large upwards or downwards movement.

Trend Classification

The trends are mainly classified as major, intermediate, and minor trends. A major trend is made of several small trends. A minor trend is a trend that occurs within a larger it also helps to form the shape of a large trend. An intermediate trend is basically a consolidation phase that signals the making of a larger trend.

A longer intermediate trend is generally followed by even a longer major trend. Similarly, an intermediate trend can also form towards the end of a major which can be taken as the signal of a trend reversal.

Below is an example of the EUR/USD chart in which you can see an intermediate trend that is followed by a major uptrend. You can also see the minor trend within the major uptrend.

Tutorials

What is Forex?

What is Forex? The Foreign Exchange market, also known as the Forex market, is the...

Currency Pairs

Currency Pairs A currency pair is a set of two currencies and its quotation determines the value of one...

Lot Size In Forex Trading

lot size in forex trading In Forex trading, a lot is a standard term for...

PIP in Forex Trading

PIP - Point in Percentage The unit for expressing the change in the currency rate...

Spread In Forex Trading

What is Spread? The spread is the difference between a currency pair's ask and bid...

Short Selling

What is Short Selling? When it comes to trading opportunities, the Forex market is unique....

Leverage In Forex Trading

What is leverage? Leverage is the process of controlling a huge sum with a small...

Order Types in Forex Trading

Order Types in Forex Trading An order is an instruction from a trader to the...

Concept Of Support and Resistance

WHAT ARE Support and Resistance IN FOREX TRADING? In Forex trading, support and resistance are...

What is Technical Analysis?

What is Technical Analysis in Forex? Technical analysis is a type of analysis that uses...

What is Fundamental Analysis?

What is Fundamental Analysis? Fundamental analysis is a type of analysis traders use to study...

Psychological Analysis

What is Psychological Analysis? Psychological analysis is the skill to control your own emotions and...

Types of Trends

Types of Trends The price movement of a financial instrument in an identifiable direction is...

Fibonacci Retracement

Fibonacci Retracement Fibonacci retracement is a popular technical tool to analyse and predict the price...

Moving Average Indicator

Moving Average Indicator Moving average is a famous technical indicator used for analyzing the financial...

Pivot Points Indicator

Pivot Points Indicator Pivot points is a technical indicator used for analyzing the support and...

Bollinger Bands

Bollinger Bands Bollinger Bands is a technical analysis tool created by John Bollinger in the...

Relative Strength Index (RSI)

Relative Strength Index (RSI) Relative Strength Index or RSI is a technical indicator that measures...

Day Trading Using ABC Trading Strategy

Day Trading Using ABC Strategy ABC trading strategy is a comprehensive day trading strategy. The...

Scalping Strategies

Scalping Stratagies Scalping is a trading technique that involves entering and exiting from the market...

Wyckoff Volume Spread Analysis

WYCKOFF Volume Spread Analysis The volume spread analysis is a unique method and it is...

Double RSI Strategy

Double RSI Strategy Let me show you a highly profitable Forex and Crypto trading strategy....

Money Management In Forex Trading

Money Management In Forex Trading Money management in trading refers to a particular set of...